| Fire incidents reported |
|---|
| Sreet name | Count |
|---|
| WASHINGTON STREET ST | 40 | | JEFFERSON STREET ST | 26 | | GRANT STREET ST | 18 | | GRANT ST | 14 | | JEFFERSON ST | 14 | | MOUNTAINEER CIRCLE CIR | 14 | | HARRISON STREET ST | 10 | | 2ND STREET ST | 8 | | COOLIDGE STREET ST | 8 | | OHIO RIVER BLVD. BLVD | 8 | | BENTLEY AVE | 6 | | CHAMP CT | 6 | | HARKER AVENUE AVE | 6 | | ROUTE 2 | 6 | | TRUMAN ST | 6 | | WASHINGTON STREET | 6 | | 1ST STREET ST | 4 | | 6TH STREET RD | 4 | | CHAMP COURT CT | 4 | | CONGO ARROYO ROAD RD | 4 | | FIESTA DRIVE | 4 | | FIESTA DRIVE DR | 4 | | KITCHEL AVE AVE | 4 | | NEWELL | 4 | | NEWELL BRIDGE | 4 |
| | | Fire incidents reported |
|---|
| Sreet name | Count |
|---|
| RACETRACK ROAD RD | 4 | | RT 2 | 4 | | SNOW HILL ROAD | 4 | | SNOW HILL ROAD RD | 4 | | TROTTER DRIVE | 4 | | 101 1ST STREET | 2 | | 101 GRANT STREET | 2 | | 107 WINSTON DRIVE | 2 | | 107 WINSTON STREET | 2 | | 165 CHURCH HILL RD | 2 | | 18 WICKSTORM COURT | 2 | | 1ST NEWELL | 2 | | 1ST ST | 2 | | 218 BENTLEY AVENUE | 2 | | 219 BENTLEY AVE | 2 | | 219 BENTLEY AVENUE | 2 | | 303 JARED LANE | 2 | | 305 TRUMAN STREET | 2 | | 38 CANARY ROAD | 2 | | 38 CANERY DRIVE | 2 | | 400 BLOCK JEFFERSON STREET | 2 | | 409 JEFFERSON STREET | 2 | | 410 GRANT STREET | 2 | | 420 JEFFERSON STREET | 2 | | |
|
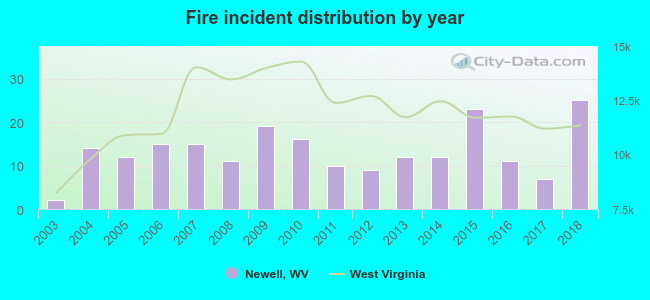 According to the data from the years 2003 - 2018 the average number of fires per year is 13. The highest number of reported fire incidents - 25 took place in 2018, and the least - 2 in 2003. The data has an increasing trend.
 Based on the data from the years 2003 - 2018 the average number of fire-related yearly casualties is 0. The highest number of injuries - 1 took place in 2005, and the lowest - 0 in 2003. The data has a constant trend.
 31.9% incidents where reported in the morning and 68.1% in the evening. The most fires (20.2%) took place on Saturday, and the least (8.0%) on Sunday.
 Based on the 213 fire incident reports from years 2003 - 2018 most fires (14.1%) took place during March, and the least (4.2%) in May.
 Out of all 1,241 cases reported during the years 2003 - 2018, the most belonged to the categories: Rescue & EMS (48.3%), Fire (17.2%), and Hazardous Condition (13.2%).
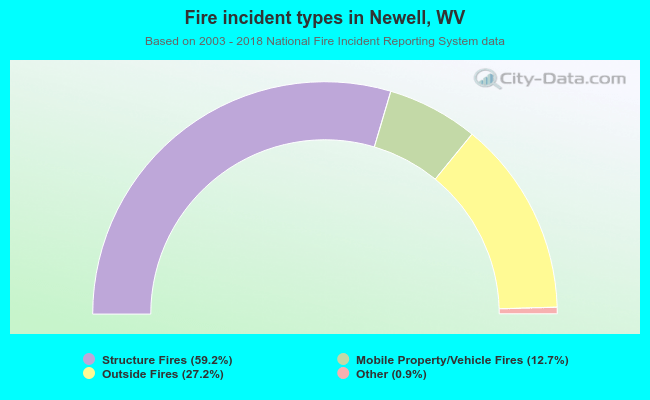 When looking into fire subcategories, the most incidents belonged to: Structure Fires (59.2%), and Outside Fires (27.2%).