Newbury: Fire Incidents, Massachusetts (MA)
Where are fire incidents reported in Newbury, MA
Something went wrong! Please refresh the page.
|
| |||||||||||||||||||||||||||||||||||||||||||||||||||||||||||||||||||||||||||||||||||||||||||||||||||||||||||||
2002 - 2018 National Fire Incident Reporting System (NFIRS) incidents
- Incident types reported to NFIRS in Newbury, MA
- 88534.7%Rescue & EMS
- 56322.1%Service Call
- 34313.5%Hazardous Condition
- 31012.2%False Alarm
- 2319.1%Fire
- 1787.0%Good Intent Call
- 190.7%Severe Weather
- 170.7%Special Incident
- Fire incident types reported to NFIRS in Newbury, MA
- 10746.3%Structure Fires
- 9139.4%Outside Fires
- 187.8%Other
- 156.5%Mobile Property/Vehicle Fires
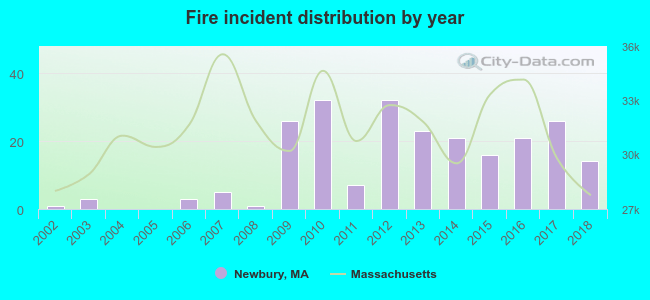 Based on the data from the years 2002 - 2018 the average number of fire incidents per year is 14. The highest number of reported fires - 32 took place in 2010, and the least - 0 in 2004. The data has a growing trend.
The average number of yearly fire incidents per 10k residents in Newbury, MA compared to nearest cities:
(Note: Based on data for the last 3 years, including only cities with population 5,000 and above)
| Newbury: | 30.5 |
| Newburyport: | 8.4 |
| Amesbury: | 35.3 |
| Georgetown: | 55.4 |
| Merrimac: | 68.9 |
| Groveland: | 32.5 |
| Hamilton: | 21.5 |
| Haverhill: | 33.9 |
| Gloucester: | 32.4 |
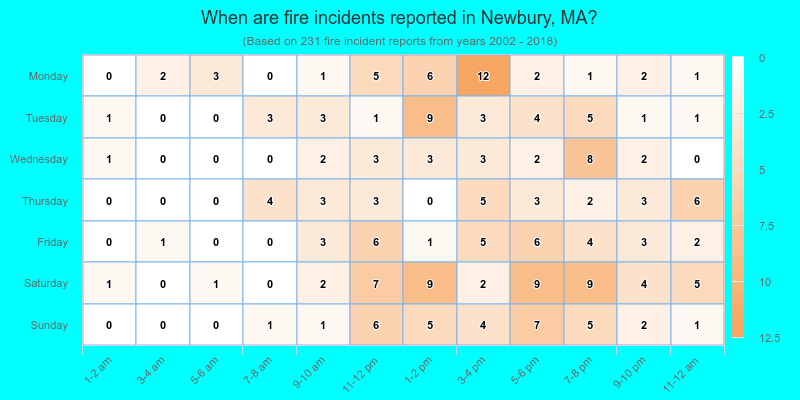
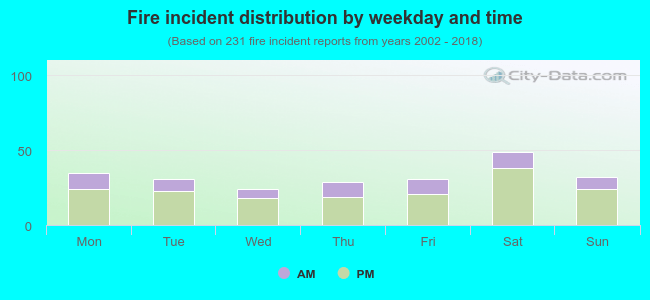 27.7% incidents where reported in the morning and 72.3% in the evening. The most fires (21.2%) took place on Saturday, and the least (10.4%) on Wednesday.
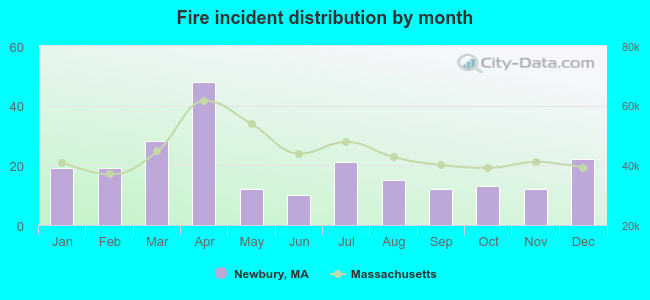 According to the 231 fire incident reports from years 2002 - 2018 most fires (20.8%) took place during April, and the least (4.3%) in June.
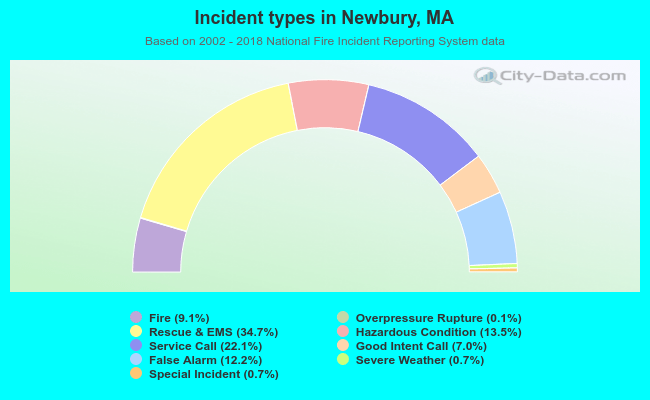 Out of all 2,548 cases reported during the years 2002 - 2018, the most belonged to the categories: Rescue & EMS (34.7%), Service Call (22.1%), and Hazardous Condition (13.5%).
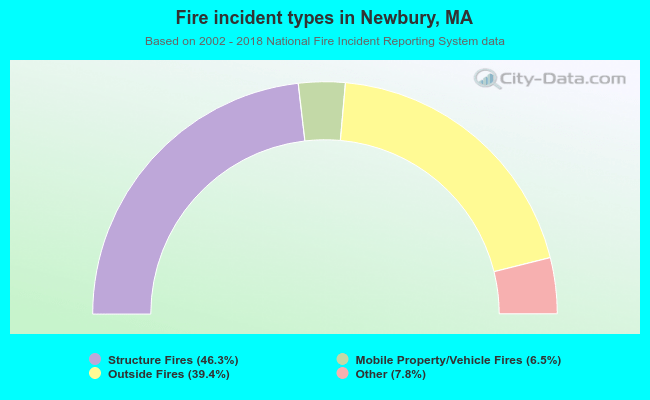 When looking into fire subcategories, the most incidents belonged to: Structure Fires (46.3%), and Outside Fires (39.4%).