Newburg: Fire Incidents, Missouri (MO)
Where are fire incidents reported in Newburg, MO
Something went wrong! Please refresh the page.
|
| |||||||||||||||||||||||||||||||||||||||||||||||||||||||||||||||||||||||||||||||||||||||||||||||||||||||||||||
| Other | 11 | |||||||||||||||||||||||||||||||||||||||||||||||||||||||||||||||||||||||||||||||||||||||||||||||||||||||||||||
2003 - 2017 National Fire Incident Reporting System (NFIRS) incidents
- Incident types reported to NFIRS in Newburg, MO
- 28559.9%Fire
- 10021.0%Rescue & EMS
- 428.8%Good Intent Call
- 316.5%Hazardous Condition
- 102.1%Service Call
- 51.1%False Alarm
- 20.4%Severe Weather
- 10.2%Overpressure Rupture
- Fire incident types reported to NFIRS in Newburg, MO
- 16959.3%Outside Fires
- 8730.5%Structure Fires
- 227.7%Mobile Property/Vehicle Fires
- 72.5%Other
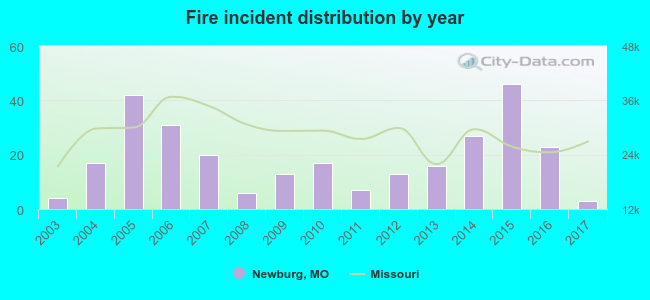 According to the data from the years 2003 - 2017 the average number of fire incidents per year is 19. The highest number of fires - 46 took place in 2015, and the least - 3 in 2017. The data has a declining trend.
 26.0% incidents where reported in the morning and 74.0% in the evening. The most fires (19.6%) took place on Sunday, and the least (9.5%) on Wednesday.
 According to the 285 fire incident reports from years 2003 - 2017 most fires (22.8%) took place during March, and the least (1.4%) in June.
 Out of all 476 cases reported during the years 2003 - 2017, the most belonged to the categories: Fire (59.9%), Rescue & EMS (21.0%), and Good Intent Call (8.8%).
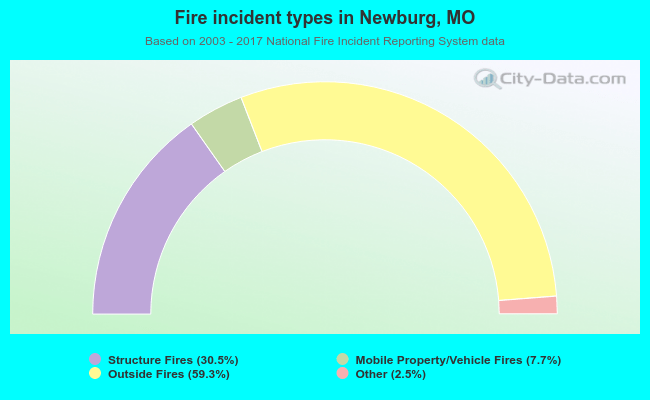 When looking into fire subcategories, the most incidents belonged to: Outside Fires (59.3%), and Structure Fires (30.5%).