Newark: Fire Incidents, Illinois (IL)
Where are fire incidents reported in Newark, IL
Something went wrong! Please refresh the page.
|
| |||||||||||||||||||||||||||||||||||||||||||||||||||||||||||||||||||||||||||||||||||||||||||||||||||||||||||||
2002 - 2018 National Fire Incident Reporting System (NFIRS) incidents
- Incident types reported to NFIRS in Newark, IL
- 77744.5%Rescue & EMS
- 37921.7%Fire
- 24514.0%Service Call
- 1398.0%Hazardous Condition
- 1206.9%Good Intent Call
- 623.6%False Alarm
- 181.0%Severe Weather
- 40.2%Overpressure Rupture
- 20.1%Special Incident
- Fire incident types reported to NFIRS in Newark, IL
- 16242.7%Outside Fires
- 14137.2%Structure Fires
- 6216.4%Mobile Property/Vehicle Fires
- 143.7%Other
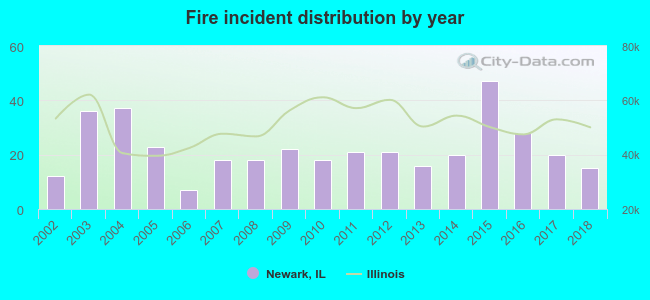 According to the data from the years 2002 - 2018 the average number of fire incidents per year is 22. The highest number of fires - 47 took place in 2015, and the least - 7 in 2006. The data has a rising trend.
 29.0% incidents where reported in the morning and 71.0% in the evening. The most fires (20.3%) took place on Saturday, and the least (9.0%) on Thursday.
 According to the 379 fire incidents from years 2002 - 2018 most fires (18.5%) took place during April, and the least (4.0%) in January.
 Out of all 1,746 cases reported during the years 2002 - 2018, the most belonged to the categories: Rescue & EMS (44.5%), Fire (21.7%), and Service Call (14.0%).
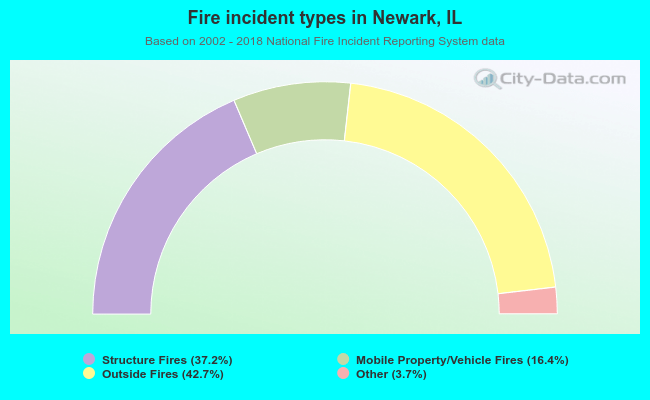 When looking into fire subcategories, the most incidents belonged to: Outside Fires (42.7%), and Structure Fires (37.2%).