New Square: Fire Incidents, New York (NY)
Where are fire incidents reported in New Square, NY
Something went wrong! Please refresh the page.
|
| |||||||||||||||||||||||||||||||||||||||||||||||||||||||||||||||||||||||||||||||||||||||||||||||||||||||||||||
2004 - 2018 National Fire Incident Reporting System (NFIRS) incidents
- Incident types reported to NFIRS in New Square, NY
- 29753.1%Fire
- 9917.7%False Alarm
- 9617.2%Hazardous Condition
- 488.6%Good Intent Call
- 122.1%Service Call
- 50.9%Rescue & EMS
- 20.4%Overpressure Rupture
- Fire incident types reported to NFIRS in New Square, NY
- 17558.9%Outside Fires
- 9130.6%Structure Fires
- 237.7%Mobile Property/Vehicle Fires
- 82.7%Other
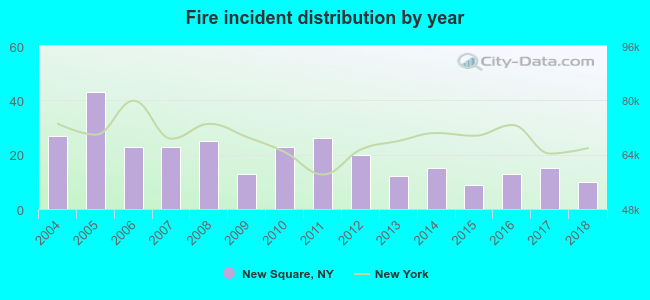 According to the data from the years 2004 - 2018 the average number of fire incidents per year is 20. The highest number of reported fire incidents - 43 took place in 2005, and the least - 9 in 2015. The data has a dropping trend.
The average number of yearly fire incidents per 10k residents in New Square, NY compared to nearest cities:
(Note: Based on data for the last 3 years, including only cities with population 5,000 and above)
| New Square: | 16.5 |
| Hillcrest: | 7.5 |
| New Hempstead: | 30.8 |
| New City: | 19.5 |
| Spring Valley: | 13.7 |
| Kaser: | 16.0 |
| Monsey: | 31.5 |
| Wesley Hills: | 31.0 |
| Viola: | 23.8 |
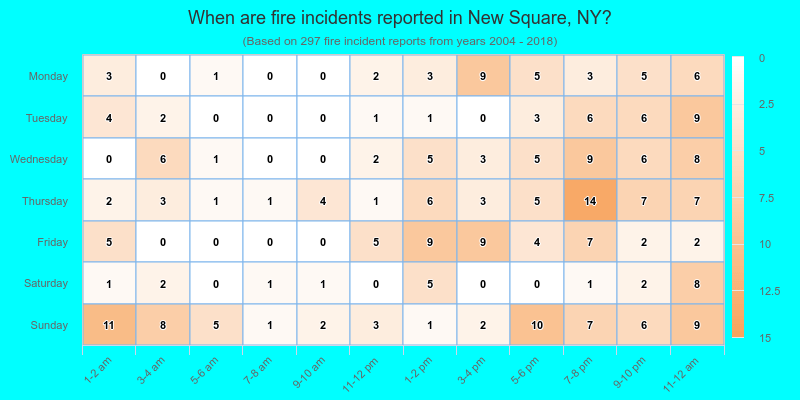
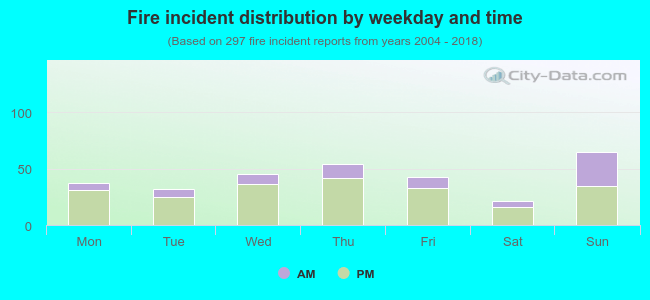 26.6% incidents where reported in the morning and 73.4% in the evening. The most fires (21.9%) took place on Sunday, and the least (7.1%) on Saturday.
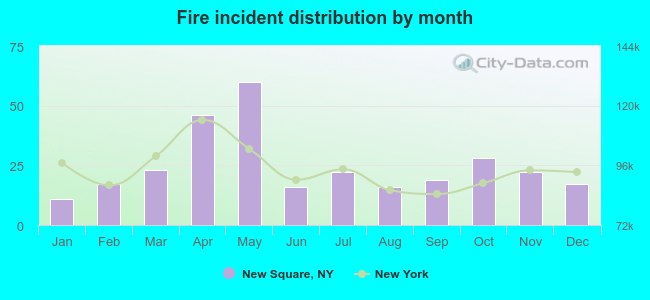 Based on the 297 fire incidents from years 2004 - 2018 most fires (20.2%) took place during May, and the least (3.7%) in January.
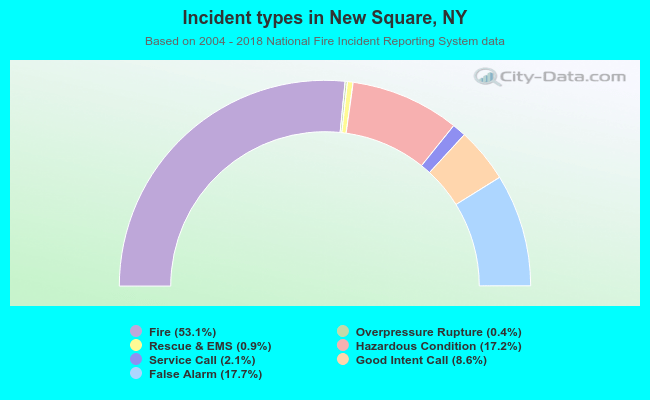 Out of all 559 cases reported during the years 2004 - 2018, the most belonged to the categories: Fire (53.1%), False Alarm (17.7%), and Hazardous Condition (17.2%).
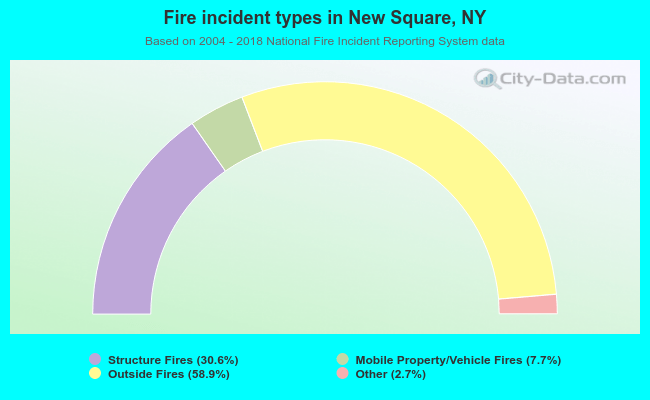 When looking into fire subcategories, the most reports belonged to: Outside Fires (58.9%), and Structure Fires (30.6%).