| Fire incidents reported |
|---|
| Sreet name | Count |
|---|
| STATE HIGHWAY 69 HWY | 20 | | LEGLER VALLEY RD RD | 12 | | COUNTY HIGHWAY O HWY | 10 | | 5TH AVE | 8 | | ARGUE ROAD | 8 | | COUNTY HIGHWAY H HWY | 8 | | COUNTY HIGHWAY A HWY | 6 | | COUNTY HIGHWAY J HWY | 6 | | EXETER CROSSING RD RD | 6 | | MARTY RD RD | 6 | | PRIMROSE CENTER RD RD | 6 | | STATE HIGHWAY 39 HWY | 6 | | STH 69 | 6 | | WITTWER RD | 6 | | 12TH AVE | 4 | | 2ND ST | 4 | | 5TH AVE. ST | 4 | | 6TH AVE | 4 | | ARGUE RD RD | 4 | | BLUE VISTA LN. LN | 4 | | COUNTY HIGHWAY CC | 4 | | COUNTY HIGHWAY N HWY | 4 | | COUNTY HWY CC | 4 | | COUNTY HWY U | 4 | | COUNTY U | 4 |
| | | Fire incidents reported |
|---|
| Sreet name | Count |
|---|
| CTH U | 4 | | DURST RD | 4 | | HWY 69 | 4 | | KUBLY RD | 4 | | KUBLY RD RD | 4 | | NYE RD | 4 | | POSTVILLE RD | 4 | | 10TH AVE | 2 | | 10TH AVENUE | 2 | | 11TH AVE ST | 2 | | 12 TH AVE ST | 2 | | 12 TH STRE | 2 | | 12TH AVENUE | 2 | | 12TH ST | 2 | | 1419 SECOND STREET | 2 | | 14TH AVE. ST | 2 | | 17 AVE | 2 | | 17TH AVE | 2 | | 180 HWY 69 | 2 | | 19TH ST | 2 | | 2ND AVE | 2 | | 2ND ST ST | 2 | | 2ND ST STRE | 2 | | 2ND STREET | 2 | | |
|
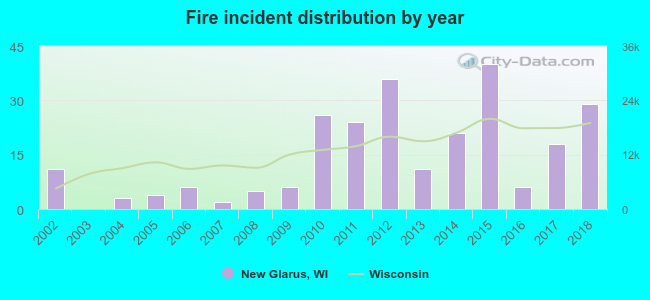 According to the data from the years 2002 - 2018 the average number of fire incidents per year is 15. The highest number of fires - 40 took place in 2015, and the least - 0 in 2003. The data has a growing trend.
 24.6% incidents where reported in the morning and 75.4% in the evening. The most fires (20.2%) took place on Saturday, and the least (10.1%) on Monday.
 According to the 248 incident reports from years 2002 - 2018 most fires (22.2%) took place during April, and the least (4.0%) in July.
 Out of all 625 cases reported during the years 2002 - 2018, the most belonged to the categories: Fire (39.7%), Rescue & EMS (30.6%), and False Alarm (11.0%).
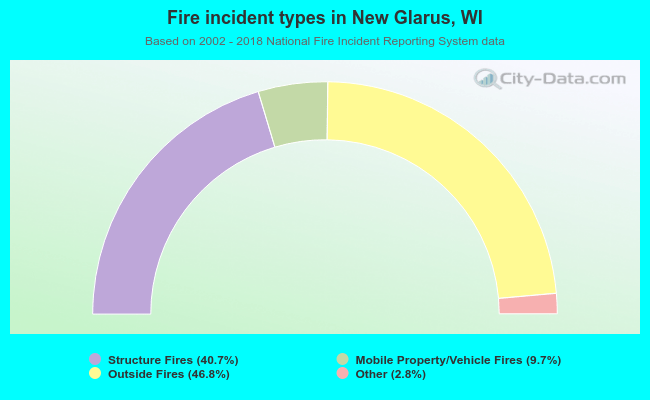 When looking into fire subcategories, the most incidents belonged to: Outside Fires (46.8%), and Structure Fires (40.7%).