New Buffalo: Fire Incidents, Michigan (MI)
Where are fire incidents reported in New Buffalo, MI
Something went wrong! Please refresh the page.
|
| |||||||||||||||||||||||||||||||||||||||||||||||||||||||||||||||||||||||||||||||||||||||||||||||||||||||||||||
2002 - 2018 National Fire Incident Reporting System (NFIRS) incidents
- Incident types reported to NFIRS in New Buffalo, MI
- 38232.3%Hazardous Condition
- 37431.6%Fire
- 16614.0%False Alarm
- 12710.7%Good Intent Call
- 907.6%Service Call
- 342.9%Rescue & EMS
- 70.6%Special Incident
- 30.3%Severe Weather
- Fire incident types reported to NFIRS in New Buffalo, MI
- 14538.8%Outside Fires
- 12332.9%Structure Fires
- 8823.5%Mobile Property/Vehicle Fires
- 184.8%Other
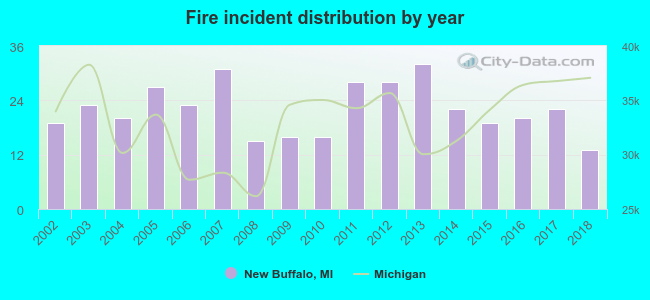 According to the data from the years 2002 - 2018 the average number of fire incidents per year is 22. The highest number of reported fires - 32 took place in 2013, and the least - 13 in 2018. The data has a declining trend.
 32.1% incidents where reported in the morning and 67.9% in the evening. The most fires (17.4%) took place on Friday, and the least (11.0%) on Tuesday.
 Based on the 374 fire incidents from years 2002 - 2018 most fires (17.6%) took place during July, and the least (2.1%) in February.
 Out of all 1,184 cases reported during the years 2002 - 2018, the most belonged to the categories: Hazardous Condition (32.3%), Fire (31.6%), and False Alarm (14.0%).
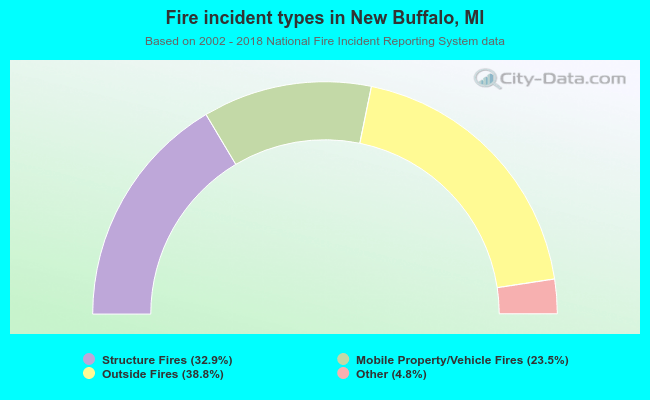 When looking into fire subcategories, the most incidents belonged to: Outside Fires (38.8%), and Structure Fires (32.9%).