New Albany: Fire Incidents, Mississippi (MS)
Where are fire incidents reported in New Albany, MS
Something went wrong! Please refresh the page.
| Fire incidents reported | |
|---|---|
| Sreet name | Count |
| BANKHEAD ST | 80 |
| 15 HWY | 74 |
| CR 115 | 72 |
| 30 HWY | 66 |
| CR 75 | 48 |
| CR 227 | 46 |
| CR 81 | 42 |
| CR 121 | 36 |
| CR 158 | 32 |
| CR 73 | 32 |
| CR 126 | 28 |
| CR 86 | 28 |
| CR 101 | 26 |
| CR 82 | 26 |
| HWY 30 | 26 |
| HWY. 15 | 26 |
| BRATTON RD | 24 |
| CR 137 | 24 |
| HWY 15 | 24 |
| HWY 15 N | 24 |
| HWY 178 E | 24 |
| HWY 30 WEST | 24 |
| HWY 348 | 24 |
| 78 HWY | 22 |
| CLEVELAND ST | 22 |
| CR 140 | 22 |
| GLENFIELD RD | 22 |
| HWY 15 SOUTH | 22 |
| MAIN ST | 22 |
| COUNTY ROAD 96 | 20 |
| Other | 1,566 |
2002 - 2018 National Fire Incident Reporting System (NFIRS) incidents
- Incident types reported to NFIRS in New Albany, MS
- 2,57450.0%Fire
- 82316.0%Rescue & EMS
- 54710.6%Good Intent Call
- 4859.4%False Alarm
- 3516.8%Service Call
- 3306.4%Hazardous Condition
- 170.3%Severe Weather
- 120.2%Overpressure Rupture
- 100.2%Special Incident
- Fire incident types reported to NFIRS in New Albany, MS
- 1,22947.7%Outside Fires
- 77130.0%Structure Fires
- 39415.3%Mobile Property/Vehicle Fires
- 1807.0%Other
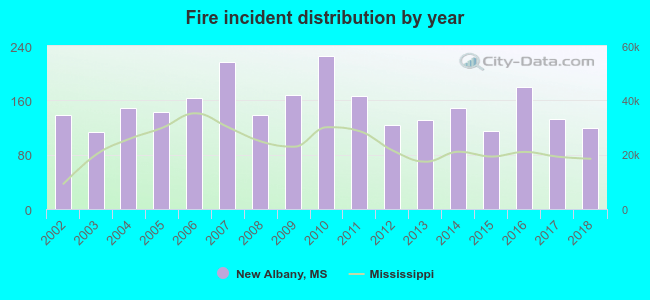 Based on the data from the years 2002 - 2018 the average number of fire incidents per year is 151. The highest number of reported fire incidents - 226 took place in 2010, and the least - 114 in 2003. The data has a decreasing trend.
The average number of yearly fire incidents per 10k residents in New Albany, MS compared to nearest cities:
(Note: Based on data for the last 3 years, including only cities with population 5,000 and above)
| New Albany: | 165.4 |
| Pontotoc: | 260.7 |
| Ripley: | 177.6 |
| Saltillo: | 171.9 |
| Tupelo: | 81.8 |
| Booneville: | 373.3 |
| Oxford: | 98.1 |
| Holly Springs: | 220.9 |
| Corinth: | 172.7 |
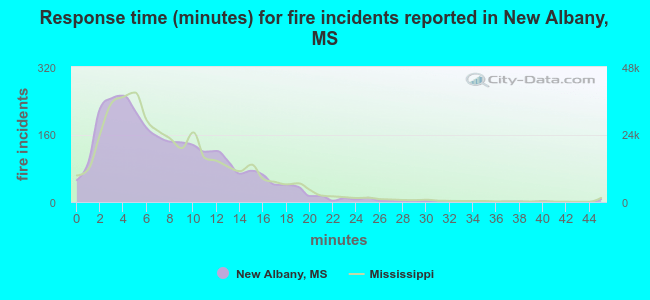 The median response time based on all reported fire incidents is 7 minutes. This is similar to the Mississippi median value.
The median response time in New Albany, MS compared to nearest cities:
(Note: Based on data for all years, including only cities with at least 500 fire incidents)
| New Albany: | 7 minutes |
| Myrtle: | 8 minutes |
| Blue Springs: | 9 minutes |
| Pontotoc: | 9 minutes |
| Ripley: | 8 minutes |
| Guntown: | 9 minutes |
| Saltillo: | 8 minutes |
| Baldwyn: | 10 minutes |
| Tupelo: | 5 minutes |
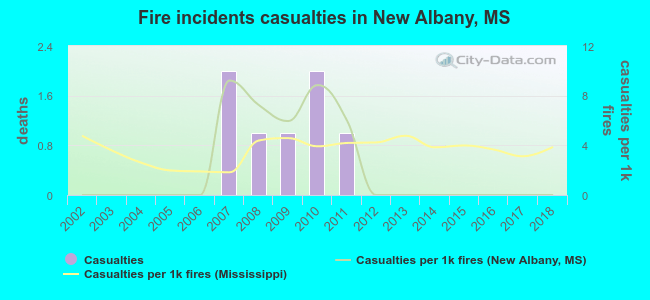 According to the data from the years 2002 - 2018 the average number of fire-related casualties per year is 0. The highest number of injuries - 2 took place in 2007, and the lowest - 0 in 2002. The data has a constant trend.
The average number of injuries per 1,000 fire incidents is 2. This indicator was the highest - 9 in 2007, and the lowest 0 in 2002. The trend for casualties per 1,000 fire incidents is constant. Compared to the state value the number of casualties per 1,000 fires is lower.
According to the data from the years 2002 - 2018 the average number of fire-related casualties per year is 0. The highest number of injuries - 2 took place in 2007, and the lowest - 0 in 2002. The data has a constant trend.
The average number of injuries per 1,000 fire incidents is 2. This indicator was the highest - 9 in 2007, and the lowest 0 in 2002. The trend for casualties per 1,000 fire incidents is constant. Compared to the state value the number of casualties per 1,000 fires is lower.
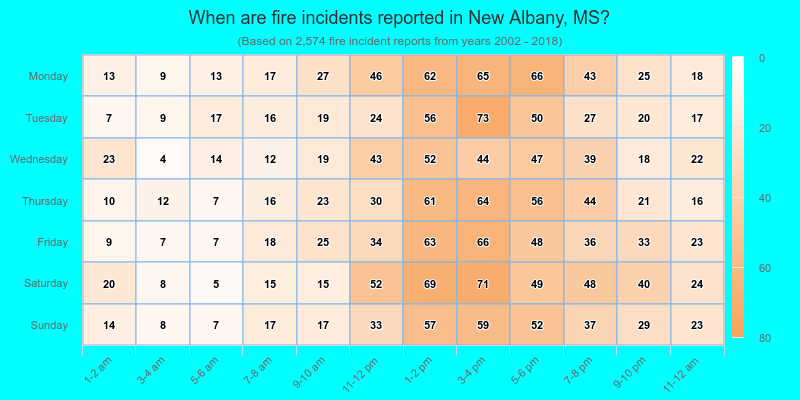
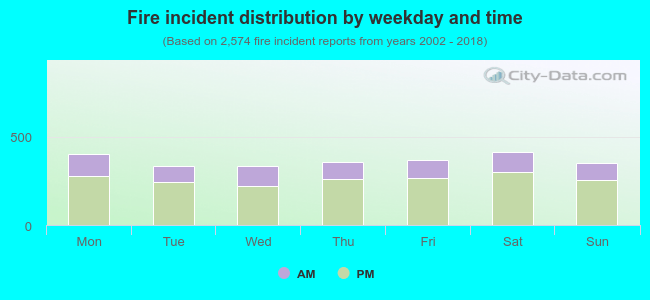 28.8% incidents where reported in the morning and 71.2% in the evening. The most fires (16.2%) took place on Saturday, and the least (13.0%) on Tuesday.
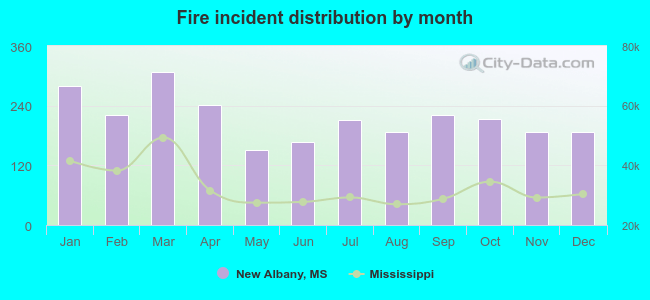 Based on the 2,574 incident reports from years 2002 - 2018 most fires (11.9%) took place during March, and the least (5.8%) in May.
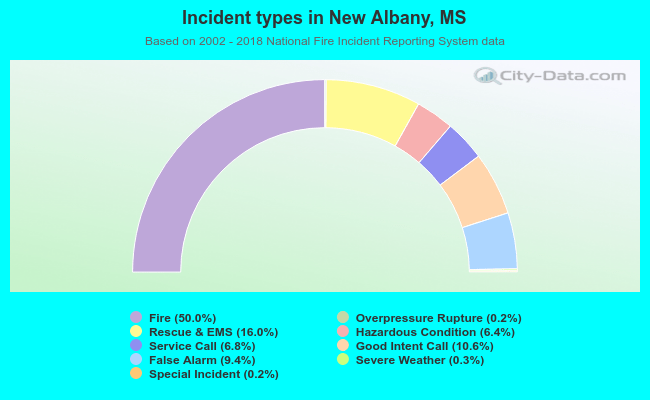 Out of all 5,149 cases reported during the years 2002 - 2018, the most belonged to the categories: Fire (50.0%), Rescue & EMS (16.0%), and Good Intent Call (10.6%).
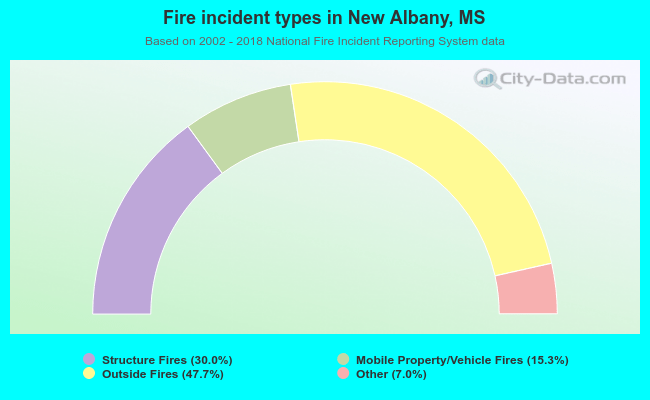 When looking into fire subcategories, the most reports belonged to: Outside Fires (47.7%), and Structure Fires (30.0%).