Nesquehoning: Fire Incidents, Pennsylvania (PA)
Where are fire incidents reported in Nesquehoning, PA
Something went wrong! Please refresh the page.
|
| |||||||||||||||||||||||||||||||||||||||||||||||||||||||||||||||||||||||||||||||||||||||||||||||||||||||||||||
2003 - 2018 National Fire Incident Reporting System (NFIRS) incidents
- Incident types reported to NFIRS in Nesquehoning, PA
- 21620.8%Rescue & EMS
- 21420.6%False Alarm
- 20019.3%Good Intent Call
- 16816.2%Fire
- 14213.7%Hazardous Condition
- 858.2%Service Call
- 90.9%Special Incident
- 20.2%Severe Weather
- Fire incident types reported to NFIRS in Nesquehoning, PA
- 10361.3%Structure Fires
- 2514.9%Other
- 2414.3%Outside Fires
- 169.5%Mobile Property/Vehicle Fires
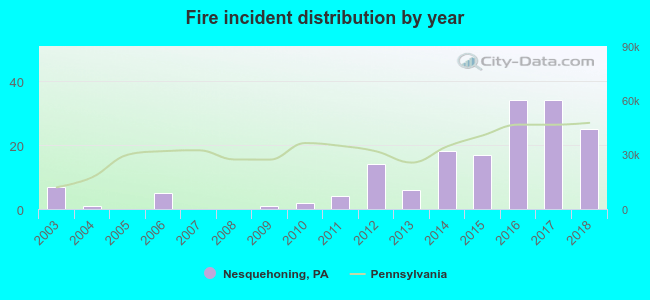 Based on the data from the years 2003 - 2018 the average number of fires per year is 11. The highest number of fires - 34 took place in 2016, and the least - 0 in 2005. The data has a growing trend.
 28.0% incidents where reported in the morning and 72.0% in the evening. The most fires (19.0%) took place on Monday, and the least (10.1%) on Saturday.
 According to the 168 fire incidents from years 2003 - 2018 most fires (14.9%) took place during March, and the least (4.8%) in October.
 Out of all 1,037 cases reported during the years 2003 - 2018, the most belonged to the categories: Rescue & EMS (20.8%), False Alarm (20.6%), and Good Intent Call (19.3%).
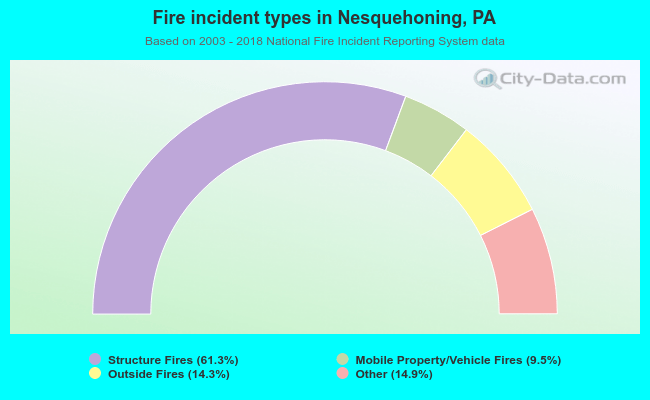 When looking into fire subcategories, the most reports belonged to: Structure Fires (61.3%), and Other (14.9%).