Neshkoro: Fire Incidents, Wisconsin (WI)
Where are fire incidents reported in Neshkoro, WI
Something went wrong! Please refresh the page.
|
| |||||||||||||||||||||||||||||||||||||||||||||||||||||||||||||||||||||||||||||||||||||||||||||||||||||||||||||
2002 - 2018 National Fire Incident Reporting System (NFIRS) incidents
- Incident types reported to NFIRS in Neshkoro, WI
- 64175.3%Rescue & EMS
- 12915.2%Fire
- 374.3%Hazardous Condition
- 192.2%False Alarm
- 131.5%Good Intent Call
- 80.9%Service Call
- 40.5%Severe Weather
- Fire incident types reported to NFIRS in Neshkoro, WI
- 7356.6%Structure Fires
- 3728.7%Outside Fires
- 1612.4%Mobile Property/Vehicle Fires
- 32.3%Other
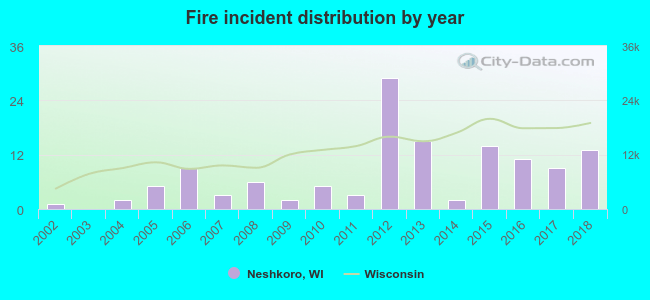 Based on the data from the years 2002 - 2018 the average number of fires per year is 8. The highest number of fires - 29 took place in 2012, and the least - 0 in 2003. The data has a rising trend.
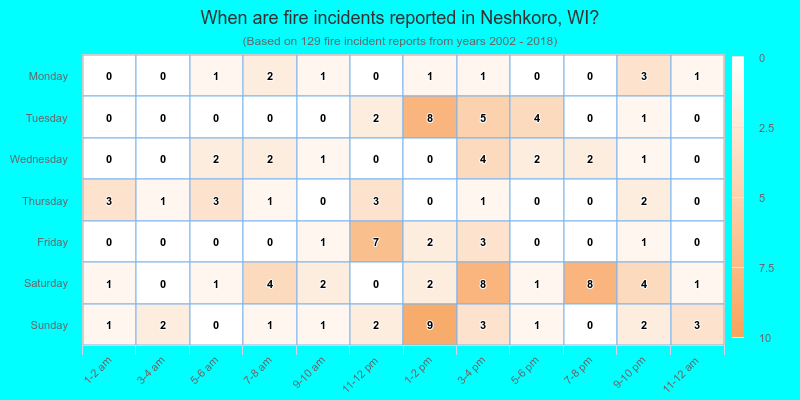
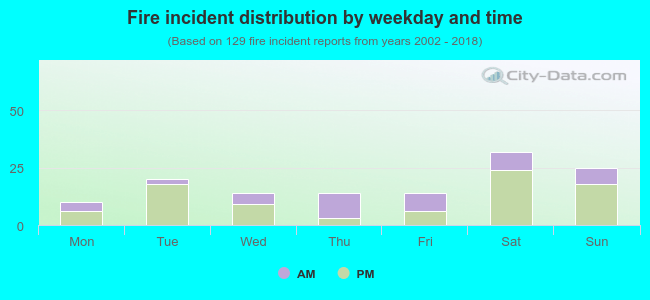 34.9% incidents where reported in the morning and 65.1% in the evening. The most fires (24.8%) took place on Saturday, and the least (7.8%) on Monday.
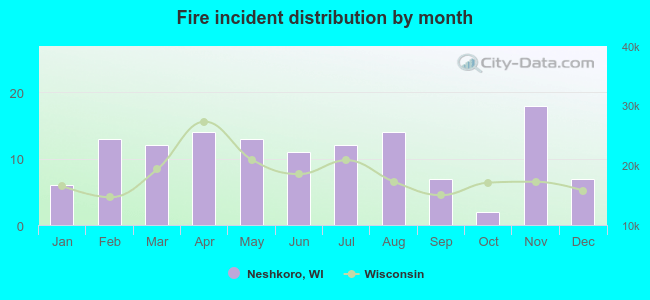 Based on the 129 incident reports from years 2002 - 2018 most fires (14.0%) took place during November, and the least (1.6%) in October.
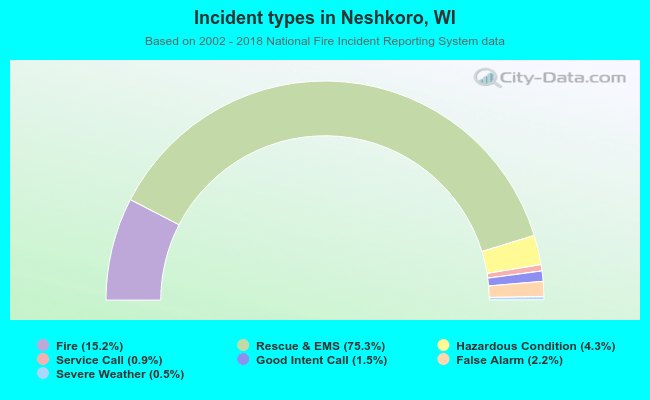 Out of all 851 cases reported during the years 2002 - 2018, the most belonged to the categories: Overpressure Rupture (75.3%), Fire (15.2%), and Rescue & EMS (4.3%).
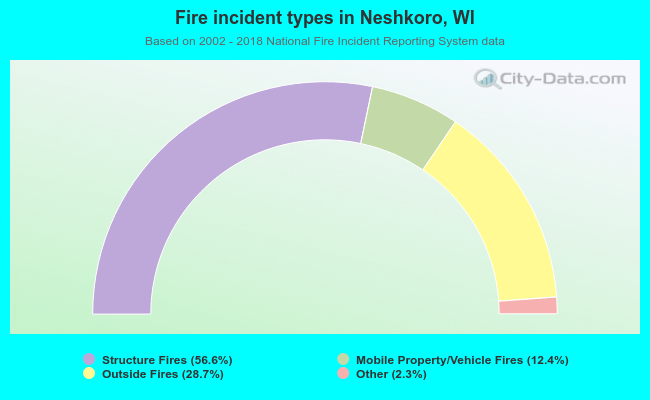 When looking into fire subcategories, the most incidents belonged to: Structure Fires (56.6%), and Outside Fires (28.7%).