Neosho Rapids: Fire Incidents, Kansas (KS)
Where are fire incidents reported in Neosho Rapids, KS
Something went wrong! Please refresh the page.
|
| |||||||||||||||||||||||||||||||||||||||||||||||||||||||||||||||||||||||||||||||||||||||||||||||||||||||||||||
2002 - 2018 National Fire Incident Reporting System (NFIRS) incidents
- Incident types reported to NFIRS in Neosho Rapids, KS
- 20147.0%Rescue & EMS
- 15436.0%Fire
- 409.3%Good Intent Call
- 214.9%Hazardous Condition
- 61.4%False Alarm
- 30.7%Severe Weather
- 20.5%Service Call
- 10.2%Special Incident
- Fire incident types reported to NFIRS in Neosho Rapids, KS
- 9561.7%Outside Fires
- 4126.6%Structure Fires
- 149.1%Mobile Property/Vehicle Fires
- 42.6%Other
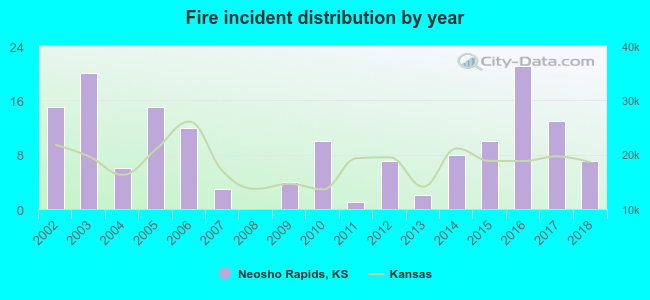 Based on the data from the years 2002 - 2018 the average number of fires per year is 9. The highest number of reported fire incidents - 21 took place in 2016, and the least - 0 in 2008. The data has a dropping trend.
 27.3% incidents where reported in the morning and 72.7% in the evening. The most fires (24.7%) took place on Saturday, and the least (9.7%) on Thursday.
 Based on the 154 fire incident reports from years 2002 - 2018 most fires (19.5%) took place during March, and the least (2.6%) in August.
 Out of all 428 cases reported during the years 2002 - 2018, the most belonged to the categories: Overpressure Rupture (47.0%), Fire (36.0%), and Service Call (9.3%).
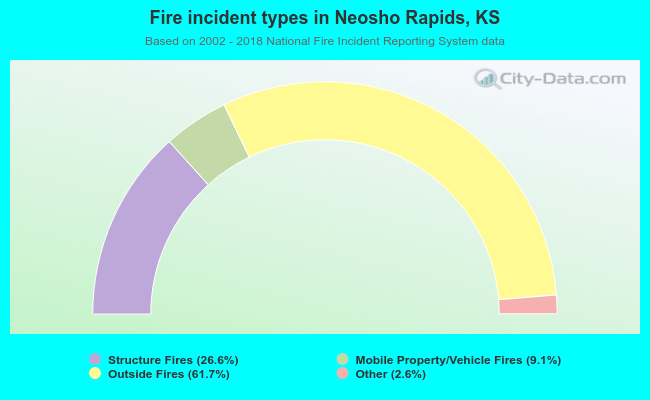 When looking into fire subcategories, the most reports belonged to: Outside Fires (61.7%), and Structure Fires (26.6%).