| Fire incidents reported |
|---|
| Sreet name | Count |
|---|
| INTERSTATE 57 | 26 | | US ROUTE 45 | 16 | | COUNTY ROAD 100 | 10 | | COUNTY ROAD 3275 | 10 | | COUNTY ROAD 500 | 10 | | RAILROAD STREET | 8 | | INTERSTATE 57 HWY | 6 | | MAPLE AVE | 6 | | SHORTS DRIVE | 6 | | 5TH ST | 4 | | 6TH ST | 4 | | 752 CO RD 500 E | 4 | | 7TH ST | 4 | | BRANSON DRIVE | 4 | | COUNTY HIGHWAY 9 | 4 | | COUNTY ROAD 1200 | 4 | | COUNTY ROAD 350 | 4 | | COUNTY ROAD 3540 | 4 | | COUNTY ROAD 500 E | 4 | | COUNTY ROAD 600 | 4 | | COUNTY ROAD 850 | 4 | | LOCUST AVE | 4 | | PINE | 4 | | RT 45 | 4 | | # 9 LAKEVIEW DRIVE | 2 |
| | | Fire incidents reported |
|---|
| Sreet name | Count |
|---|
| #9 LAKEVIEW DRIVE | 2 | | 000 E 1/2 MILE NORTH 1400N | 2 | | 000 E. 1400 N | 2 | | 075 E 1200 N | 2 | | 1/2 MILE N OF SEXTON CORONER | 2 | | 1000 N 300 E | 2 | | 1000N 500E | 2 | | 101 TROWBRIDGE ROAD | 2 | | 1016 COUNTY ROAD 1200 N | 2 | | 1030 US ROUTE 45 | 2 | | 1030 US RTE. 45 | 2 | | 1076 ROUTE 45 | 2 | | 1076 US RTE 45 | 2 | | 1084 CR 100 E | 2 | | 1095 US RT 45 | 2 | | 1095 US RT 45 NORTH | 2 | | 1095 US RTE 45 | 2 | | 1106 LAKE AVE. | 2 | | 1118 CO RD 000 E | 2 | | 1147 CO RD 000E | 2 | | 1175 CO RD 500 E | 2 | | 1200 N IL RT 45 JCT | 2 | | 1200N 1/2 MILE W OF 121 | 2 | | 1260 DOGWOOD | 2 | | 1300 NORTH | 2 |
|
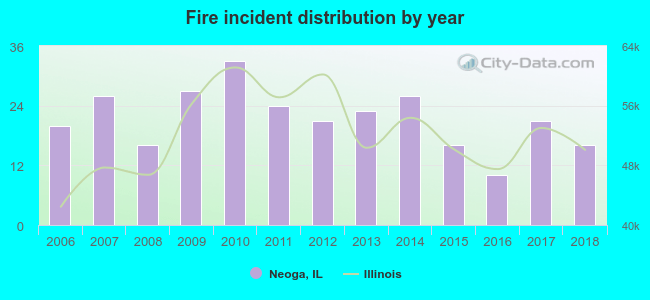 Based on the data from the years 2006 - 2018 the average number of fires per year is 21. The highest number of fire incidents - 33 took place in 2010, and the least - 10 in 2016. The data has a declining trend.
 29.0% incidents where reported in the morning and 71.0% in the evening. The most fires (20.1%) took place on Tuesday, and the least (9.7%) on Thursday.
 According to the 279 fire incidents from years 2006 - 2018 most fires (12.5%) took place during March, and the least (4.7%) in June.
 Out of all 585 cases reported during the years 2006 - 2018, the most belonged to the categories: Fire (47.7%), Overpressure Rupture (21.7%), and Service Call (11.8%).
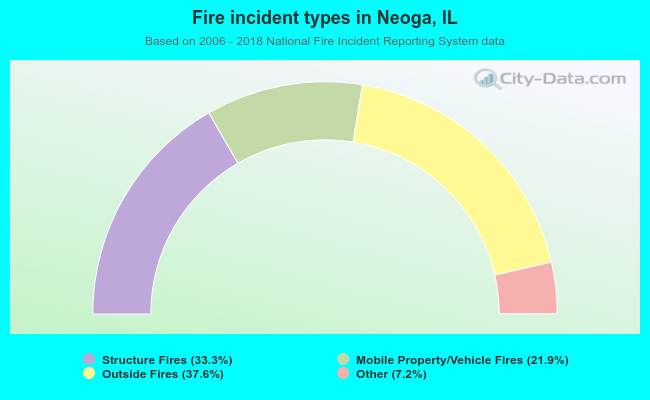 When looking into fire subcategories, the most reports belonged to: Outside Fires (37.6%), and Structure Fires (33.3%).