Negaunee: Fire Incidents, Michigan (MI)
Where are fire incidents reported in Negaunee, MI
Something went wrong! Please refresh the page.
|
| |||||||||||||||||||||||||||||||||||||||||||||||||||||||||||||||||||||||||||||||||||||||||||||||||||||||||||||
2002 - 2018 National Fire Incident Reporting System (NFIRS) incidents
- Incident types reported to NFIRS in Negaunee, MI
- 40436.2%Rescue & EMS
- 26723.9%Fire
- 26023.3%Hazardous Condition
- 11410.2%Good Intent Call
- 363.2%False Alarm
- 282.5%Service Call
- 70.6%Severe Weather
- Fire incident types reported to NFIRS in Negaunee, MI
- 11743.8%Structure Fires
- 7126.6%Outside Fires
- 4818.0%Mobile Property/Vehicle Fires
- 3111.6%Other
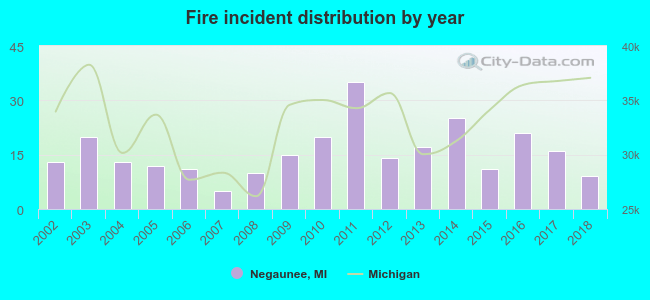 According to the data from the years 2002 - 2018 the average number of fires per year is 16. The highest number of fires - 35 took place in 2011, and the least - 5 in 2007. The data has a decreasing trend.
 24.0% incidents where reported in the morning and 76.0% in the evening. The most fires (18.7%) took place on Thursday, and the least (10.5%) on Sunday.
 According to the 267 incident reports from years 2002 - 2018 most fires (12.7%) took place during June, and the least (4.5%) in September.
 Out of all 1,117 cases reported during the years 2002 - 2018, the most belonged to the categories: Rescue & EMS (36.2%), Fire (23.9%), and Hazardous Condition (23.3%).
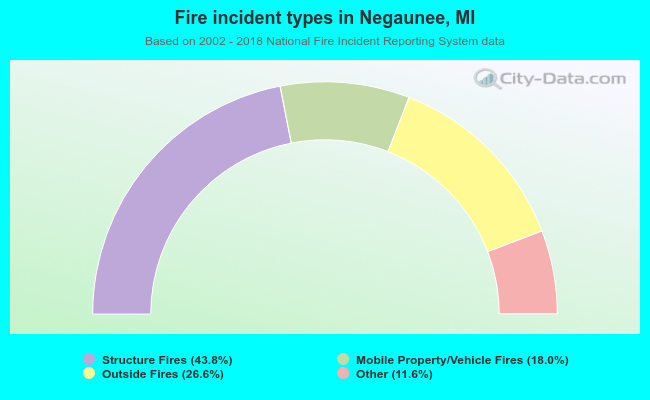 When looking into fire subcategories, the most reports belonged to: Structure Fires (43.8%), and Outside Fires (26.6%).