Nebraska City: Fire Incidents, Nebraska (NE)
Where are fire incidents reported in Nebraska City, NE
Something went wrong! Please refresh the page.
|
| |||||||||||||||||||||||||||||||||||||||||||||||||||||||||||||||||||||||||||||||||||||||||||||||||||||||||||||
2002 - 2018 National Fire Incident Reporting System (NFIRS) incidents
- Incident types reported to NFIRS in Nebraska City, NE
- 56965.4%Fire
- 11112.8%Rescue & EMS
- 789.0%False Alarm
- 718.2%Hazardous Condition
- 242.8%Good Intent Call
- 121.4%Service Call
- 20.2%Overpressure Rupture
- 20.2%Special Incident
- 10.1%Severe Weather
- Fire incident types reported to NFIRS in Nebraska City, NE
- 25745.2%Outside Fires
- 17430.6%Structure Fires
- 11520.2%Mobile Property/Vehicle Fires
- 234.0%Other
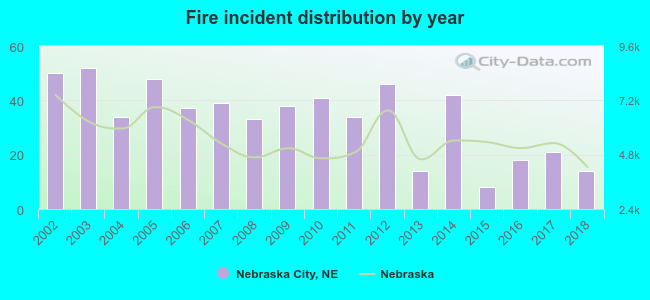 According to the data from the years 2002 - 2018 the average number of fires per year is 33. The highest number of fire incidents - 52 took place in 2003, and the least - 8 in 2015. The data has a decreasing trend.
The average number of yearly fire incidents per 10k residents in Nebraska City, NE compared to nearest cities:
(Note: Based on data for the last 3 years, including only cities with population 5,000 and above)
| Nebraska City: | 24.3 |
| Plattsmouth: | 41.1 |
| Bellevue: | 18.4 |
| Papillion: | 2.7 |
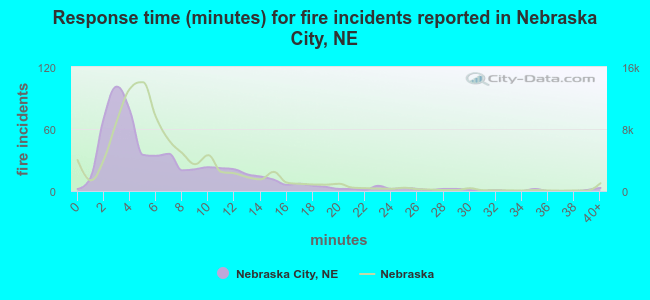 The median response time based on all reported fire incidents is 5 minutes. This is lower compared to the Nebraska median value.
The median response time in Nebraska City, NE compared to nearest cities:
(Note: Based on data for all years, including only cities with at least 500 fire incidents)
| Nebraska City: | 5 minutes |
| Shenandoah: | 4 minutes |
| Bellevue: | 6 minutes |
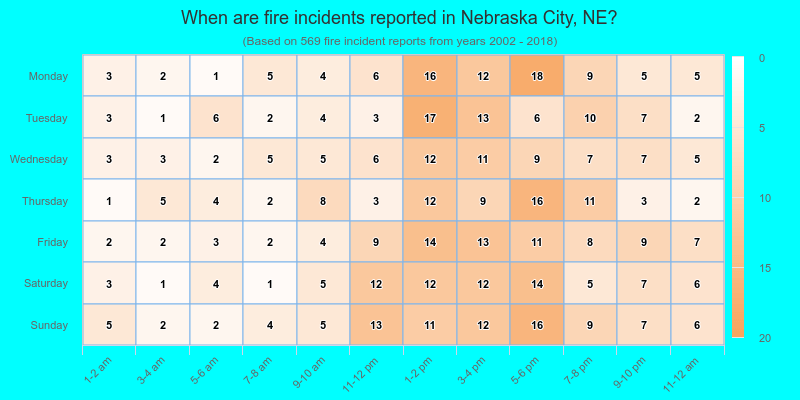
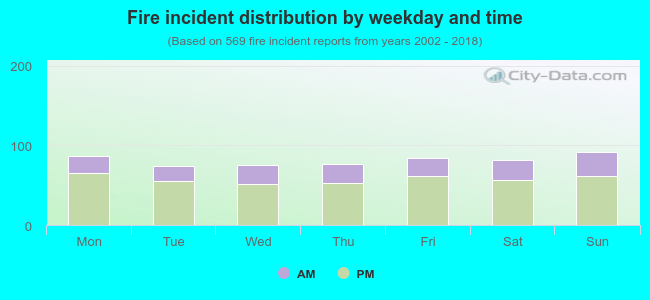 29.2% incidents where reported in the morning and 70.8% in the evening. The most fires (16.2%) took place on Sunday, and the least (13.0%) on Tuesday.
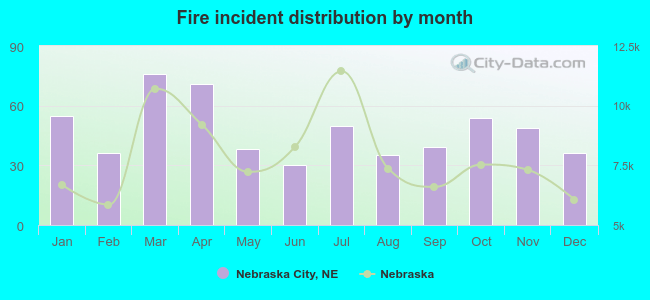 According to the 569 incident reports from years 2002 - 2018 most fires (13.4%) took place during March, and the least (5.3%) in June.
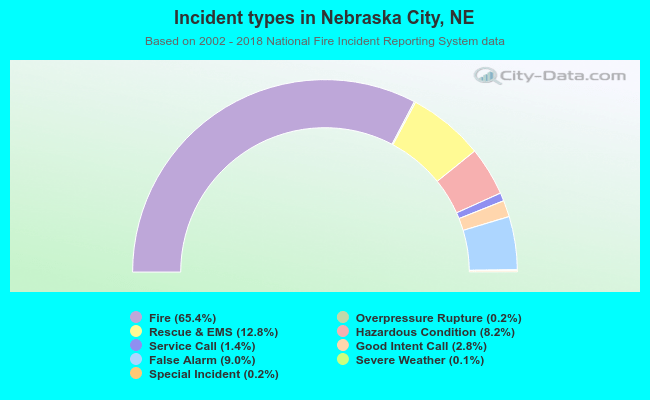 Out of all 870 cases reported during the years 2002 - 2018, the most belonged to the categories: Fire (65.4%), Rescue & EMS (12.8%), and False Alarm (9.0%).
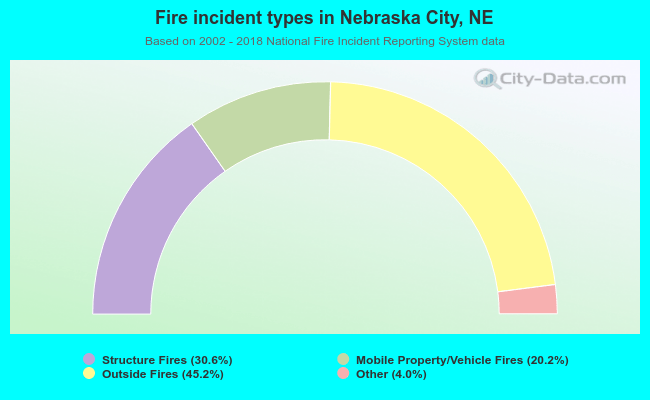 When looking into fire subcategories, the most incidents belonged to: Outside Fires (45.2%), and Structure Fires (30.6%).