| Fire incidents reported |
|---|
| Sreet name | Count |
|---|
| LURCH ROAD | 8 | | STATE LINE ROAD | 8 | | NARROWS RD | 6 | | RT 460 WEST | 6 | | WOLF CREEK ROAD | 6 | | WOLF ST | 6 | | 413 MONROE STREET | 4 | | BLANKENSHIP MOUNTAIN RD | 4 | | COLLEGE STREET | 4 | | PINEY GROVE DR | 4 | | RT 460 EAST BOUND LANE | 4 | | RT 61 | 4 | | STOCK PEN MOUNTAIN RD | 4 | | STOCK PEN MTS | 4 | | VIRGINIA AVE | 4 | | WALNUT GROVE RD | 4 | | WOLF CREEK HWY | 4 | | WOLF CREEK RD | 4 | | WARNER ST | 2 | | 1002 WOLF ST. | 2 | | 1008 WESTVIEW STREET | 2 | | 102 HALE STREET | 2 | | 102 RAINBOW DR. | 2 | | 103 BLANKSHIP STREET | 2 | | 103 EAST RIVER MNT. RD | 2 |
| | | Fire incidents reported |
|---|
| Sreet name | Count |
|---|
| 105 WARNET STREET | 2 | | 108 STATE LINE ROAD | 2 | | 109 RISLEY CIRCLE | 2 | | 110 BRIDGE STREET | 2 | | 110 WILLOW RD | 2 | | 1101 WESTVIEW STREET | 2 | | 1102 WESTVIEW SRTEET | 2 | | 1102 WESTVIEWV STREET | 2 | | 1108 COLLEGE ST. | 2 | | 1110 COLLAGE STREET | 2 | | 1111 MIDWAY STREET | 2 | | 113 BROOKSIDE DR | 2 | | 113 ED DRIVE | 2 | | 115 LOCUST STREET | 2 | | 116 HARD ROCK DRIVE | 2 | | 117 DOGWOOD LANE | 2 | | 120 EAST RIVER MNT RD | 2 | | 122 CONLEY ROAD | 2 | | 124 STARLIGHT DRIVE | 2 | | 1244 WOLF CREEK ROAD | 2 | | 125 BOY SCOUT ROAD | 2 | | 125 DILL STREET | 2 | | 1266 WOLF CREEK RD | 2 | | 1297 WOLF CREEK ROAD | 2 | | 1323 WOLFCREEK RD. | 2 |
|
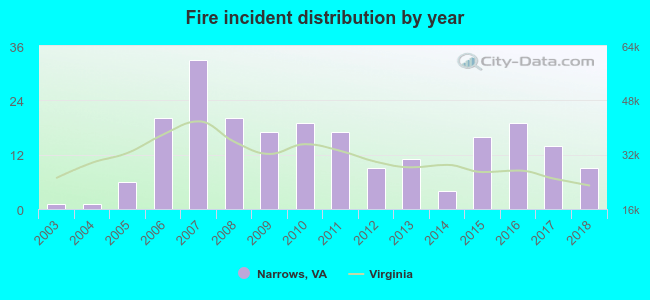 According to the data from the years 2003 - 2018 the average number of fires per year is 14. The highest number of reported fires - 33 took place in 2007, and the least - 1 in 2003. The data has a growing trend.
 30.6% incidents where reported in the morning and 69.4% in the evening. The most fires (18.5%) took place on Tuesday, and the least (11.6%) on Friday.
 According to the 216 reports from years 2003 - 2018 most fires (12.0%) took place during February, and the least (4.2%) in May.
 Out of all 683 cases reported during the years 2003 - 2018, the most belonged to the categories: Fire (31.6%), Rescue & EMS (24.5%), and Overpressure Rupture (21.4%).
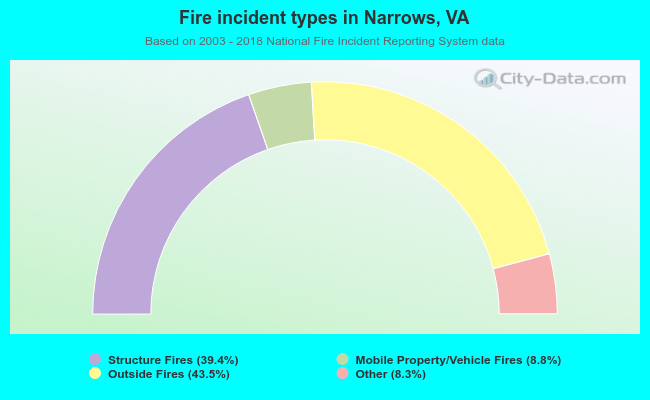 When looking into fire subcategories, the most reports belonged to: Outside Fires (43.5%), and Structure Fires (39.4%).