Naples: Fire Incidents, Texas (TX)
Where are fire incidents reported in Naples, TX
Something went wrong! Please refresh the page.
|
| |||||||||||||||||||||||||||||||||||||||||||||||||||||||||||||||||||||||||||||||||||||||||||||||||||||||||||||
| Other | 26 | |||||||||||||||||||||||||||||||||||||||||||||||||||||||||||||||||||||||||||||||||||||||||||||||||||||||||||||
2002 - 2018 National Fire Incident Reporting System (NFIRS) incidents
- Incident types reported to NFIRS in Naples, TX
- 86662.7%Rescue & EMS
- 38227.6%Fire
- 836.0%Hazardous Condition
- 322.3%Good Intent Call
- 80.6%False Alarm
- 50.4%Service Call
- 50.4%Severe Weather
- Fire incident types reported to NFIRS in Naples, TX
- 19952.1%Outside Fires
- 12031.4%Structure Fires
- 5313.9%Mobile Property/Vehicle Fires
- 102.6%Other
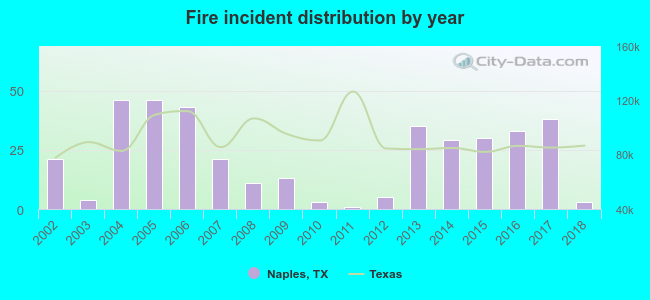 Based on the data from the years 2002 - 2018 the average number of fire incidents per year is 22. The highest number of fire incidents - 46 took place in 2004, and the least - 1 in 2011. The data has a declining trend.
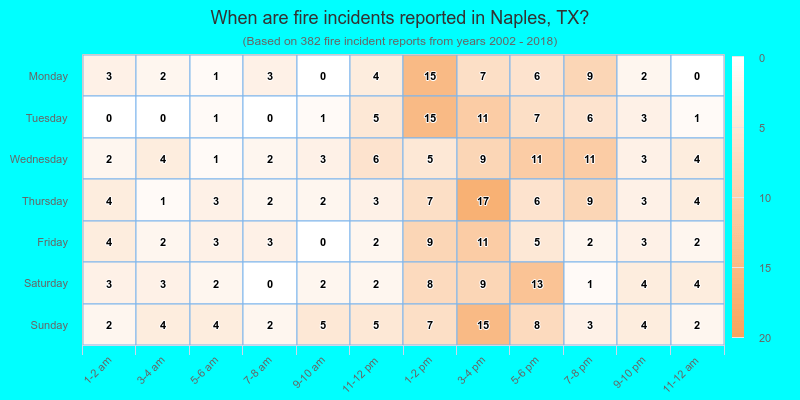
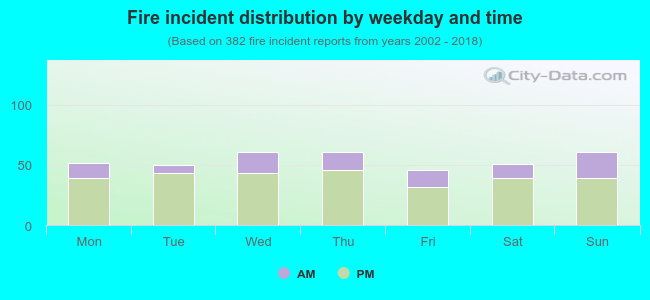 26.4% incidents where reported in the morning and 73.6% in the evening. The most fires (16.0%) took place on Wednesday, and the least (12.0%) on Friday.
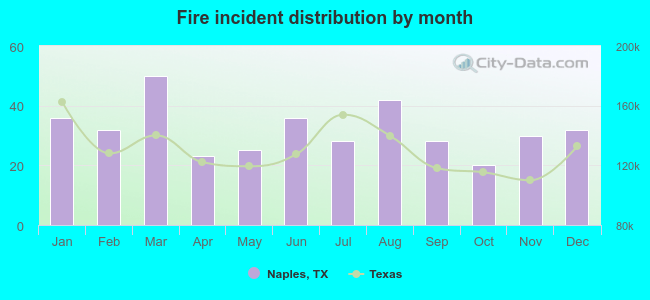 Based on the 382 incident reports from years 2002 - 2018 most fires (13.1%) took place during March, and the least (5.2%) in October.
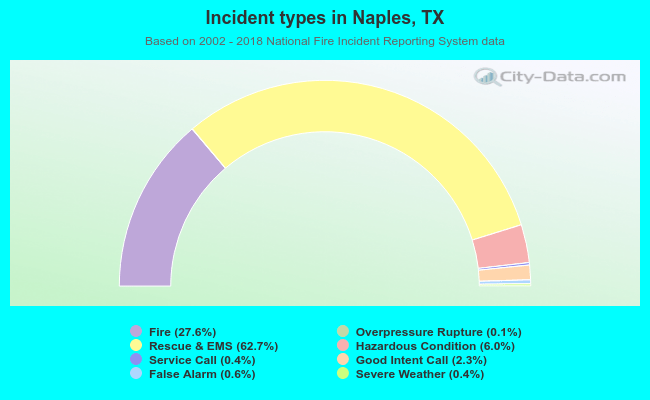 Out of all 1,382 cases reported during the years 2002 - 2018, the most belonged to the categories: Rescue & EMS (62.7%), Fire (27.6%), and Hazardous Condition (6.0%).
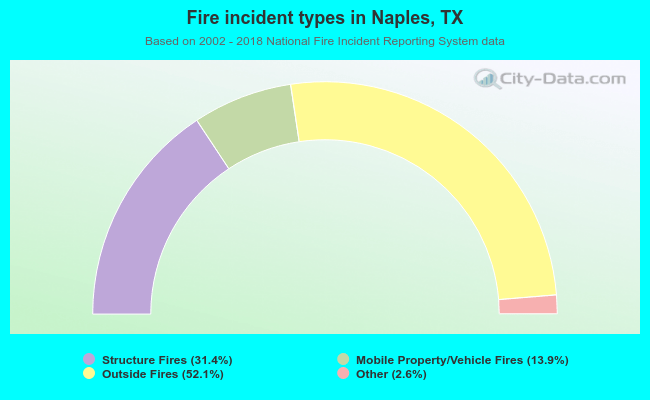 When looking into fire subcategories, the most incidents belonged to: Outside Fires (52.1%), and Structure Fires (31.4%).