Nancy: Fire Incidents, Kentucky (KY)
Where are fire incidents reported in Nancy, KY
Something went wrong! Please refresh the page.
|
| |||||||||||||||||||||||||||||||||||||||||||||||||||||||||||||||||||||||||||||||||||||||||||||||||||||||||||||
| Other | 91 | |||||||||||||||||||||||||||||||||||||||||||||||||||||||||||||||||||||||||||||||||||||||||||||||||||||||||||||
2002 - 2018 National Fire Incident Reporting System (NFIRS) incidents
- Incident types reported to NFIRS in Nancy, KY
- 27362.9%Fire
- 9722.4%Rescue & EMS
- 276.2%Service Call
- 184.1%Good Intent Call
- 133.0%Hazardous Condition
- 61.4%False Alarm
- Fire incident types reported to NFIRS in Nancy, KY
- 11241.0%Outside Fires
- 11040.3%Structure Fires
- 2810.3%Mobile Property/Vehicle Fires
- 238.4%Other
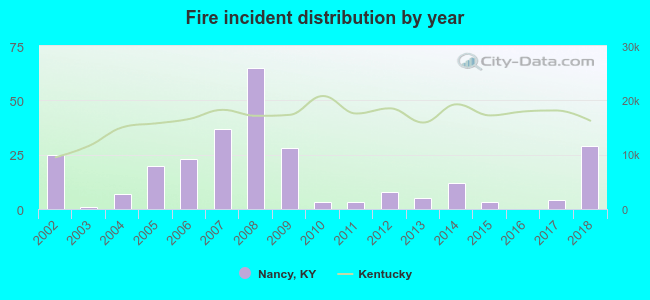 According to the data from the years 2002 - 2018 the average number of fires per year is 16. The highest number of reported fire incidents - 65 took place in 2008, and the least - 0 in 2016. The data has a rising trend.
The average number of yearly fire incidents per 10k residents in Nancy, KY compared to nearest cities:
(Note: Based on data for the last 3 years, including only cities with population 5,000 and above)
| Nancy: | 32.2 |
| Somerset: | 154.4 |
| Monticello: | 171.7 |
| Waynesburg: | 64.9 |
| Keavy: | 3.3 |
| Campbellsville: | 62.0 |
| Corbin: | 151.9 |
| London: | 195.7 |
| Danville: | 54.6 |

 30.8% incidents where reported in the morning and 69.2% in the evening. The most fires (16.1%) took place on Monday, and the least (12.5%) on Wednesday.
 Based on the 273 incident reports from years 2002 - 2018 most fires (15.8%) took place during February, and the least (4.8%) in August.
 Out of all 434 cases reported during the years 2002 - 2018, the most belonged to the categories: Fire (62.9%), Overpressure Rupture (22.4%), and Hazardous Condition (6.2%).
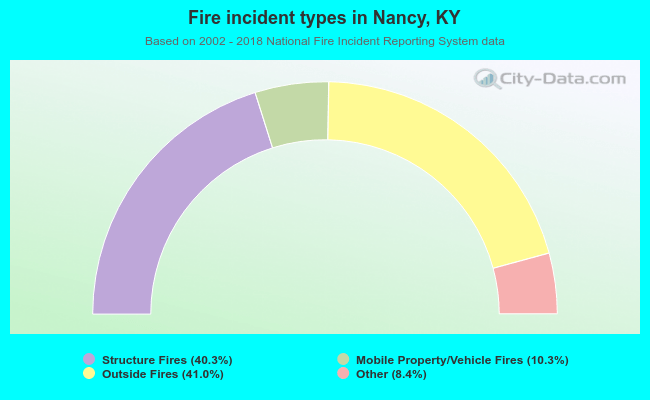 When looking into fire subcategories, the most reports belonged to: Outside Fires (41.0%), and Structure Fires (40.3%).