Naalehu: Fire Incidents, Hawaii (HI)
Where are fire incidents reported in Naalehu, HI
Something went wrong! Please refresh the page.
|
| |||||||||||||||||||||||||||||||||||||||||||||||||||||||||||||||||||||||||||||||||||||||||||||||||||||||||||||
2003 - 2018 National Fire Incident Reporting System (NFIRS) incidents
- Incident types reported to NFIRS in Naalehu, HI
- 75949.1%Rescue & EMS
- 37124.0%Fire
- 20613.3%Good Intent Call
- 1278.2%Service Call
- 704.5%Hazardous Condition
- 100.6%False Alarm
- 20.1%Severe Weather
- Fire incident types reported to NFIRS in Naalehu, HI
- 28376.3%Outside Fires
- 6517.5%Structure Fires
- 236.2%Mobile Property/Vehicle Fires
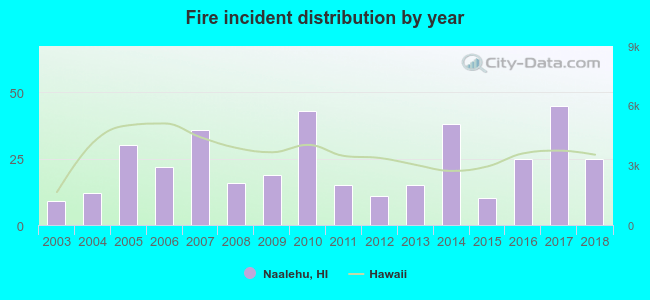 According to the data from the years 2003 - 2018 the average number of fire incidents per year is 23. The highest number of fires - 45 took place in 2017, and the least - 9 in 2003. The data has an increasing trend.
 38.3% incidents where reported in the morning and 61.7% in the evening. The most fires (17.0%) took place on Sunday, and the least (11.6%) on Tuesday.
 According to the 371 fire incident reports from years 2003 - 2018 most fires (15.6%) took place during June, and the least (5.1%) in October.
 Out of all 1,545 cases reported during the years 2003 - 2018, the most belonged to the categories: Overpressure Rupture (49.1%), Fire (24.0%), and Service Call (13.3%).
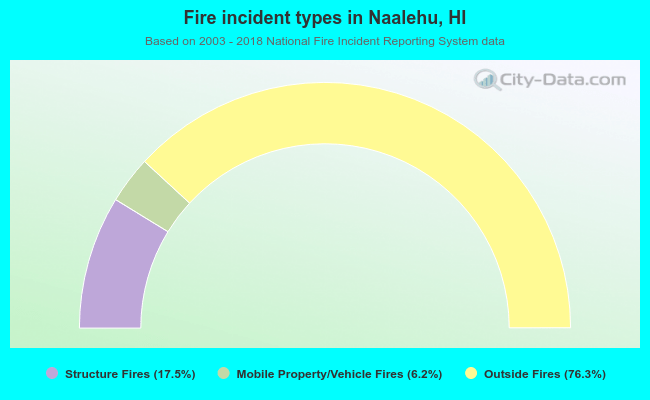 When looking into fire subcategories, the most incidents belonged to: Outside Fires (76.3%), and Structure Fires (17.5%).