Murfreesboro: Fire Incidents, North Carolina (NC)
Where are fire incidents reported in Murfreesboro, NC
Something went wrong! Please refresh the page.
|
| |||||||||||||||||||||||||||||||||||||||||||||||||||||||||||||||||||||||||||||||||||||||||||||||||||||||||||||
| Other | 15 | |||||||||||||||||||||||||||||||||||||||||||||||||||||||||||||||||||||||||||||||||||||||||||||||||||||||||||||
2003 - 2018 National Fire Incident Reporting System (NFIRS) incidents
- Incident types reported to NFIRS in Murfreesboro, NC
- 35543.6%Fire
- 21326.1%False Alarm
- 12114.8%Hazardous Condition
- 627.6%Rescue & EMS
- 516.3%Good Intent Call
- 70.9%Service Call
- 40.5%Severe Weather
- 10.1%Overpressure Rupture
- 10.1%Special Incident
- Fire incident types reported to NFIRS in Murfreesboro, NC
- 15242.8%Structure Fires
- 12936.3%Outside Fires
- 6117.2%Mobile Property/Vehicle Fires
- 133.7%Other
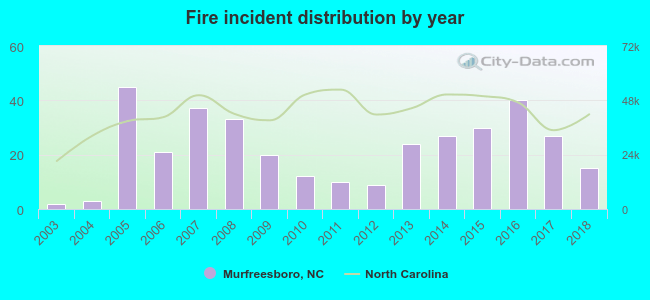 According to the data from the years 2003 - 2018 the average number of fires per year is 22. The highest number of fires - 45 took place in 2005, and the least - 2 in 2003. The data has an increasing trend.
 According to the reports from the years 2003 - 2018 the average number of fire-related fatalities per year is 0. The highest number of deaths - 3 took place in 2016, and the lowest - 0 in 2003. The data has a constant trend.
 31.0% incidents where reported in the morning and 69.0% in the evening. The most fires (18.0%) took place on Wednesday, and the least (12.1%) on Tuesday.
 Based on the 355 fire incident reports from years 2003 - 2018 most fires (13.2%) took place during February, and the least (4.8%) in July.
 Out of all 815 cases reported during the years 2003 - 2018, the most belonged to the categories: Fire (43.6%), False Alarm (26.1%), and Hazardous Condition (14.8%).
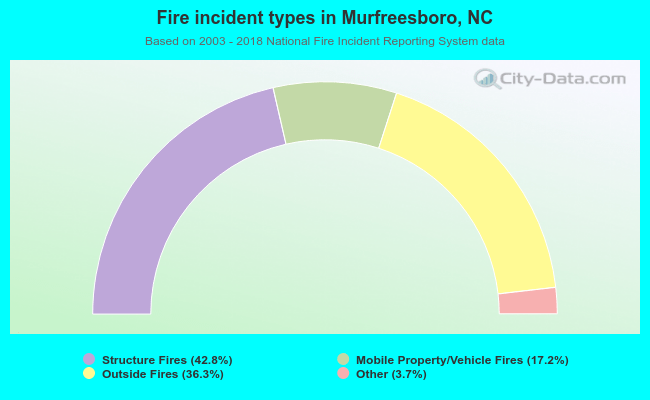 When looking into fire subcategories, the most incidents belonged to: Structure Fires (42.8%), and Outside Fires (36.3%).