Munising: Fire Incidents, Michigan (MI)
Where are fire incidents reported in Munising, MI
Something went wrong! Please refresh the page.
|
| |||||||||||||||||||||||||||||||||||||||||||||||||||||||||||||||||||||||||||||||||||||||||||||||||||||||||||||
2002 - 2018 National Fire Incident Reporting System (NFIRS) incidents
- Incident types reported to NFIRS in Munising, MI
- 13136.2%Fire
- 10729.6%Hazardous Condition
- 3810.5%Good Intent Call
- 318.6%False Alarm
- 298.0%Service Call
- 215.8%Rescue & EMS
- 41.1%Overpressure Rupture
- 10.3%Severe Weather
- Fire incident types reported to NFIRS in Munising, MI
- 8867.2%Structure Fires
- 2317.6%Outside Fires
- 1511.5%Mobile Property/Vehicle Fires
- 53.8%Other
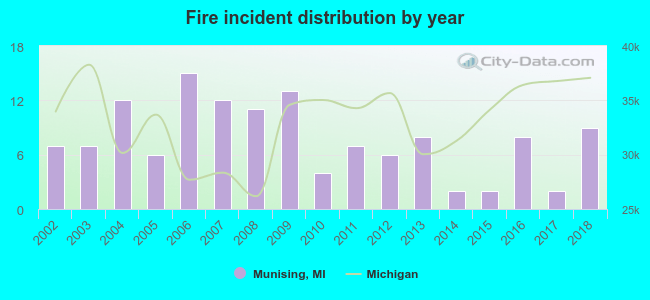 According to the data from the years 2002 - 2018 the average number of fires per year is 8. The highest number of fire incidents - 15 took place in 2006, and the least - 2 in 2014. The data has a growing trend.
 33.6% incidents where reported in the morning and 66.4% in the evening. The most fires (17.6%) took place on Monday, and the least (9.2%) on Tuesday.
 Based on the 131 fire incident reports from years 2002 - 2018 most fires (12.2%) took place during January, and the least (3.1%) in June.
 Out of all 362 cases reported during the years 2002 - 2018, the most belonged to the categories: Fire (36.2%), Hazardous Condition (29.6%), and Good Intent Call (10.5%).
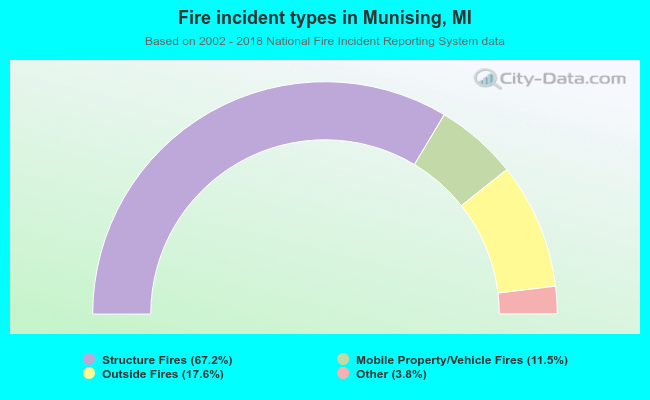 When looking into fire subcategories, the most incidents belonged to: Structure Fires (67.2%), and Outside Fires (17.6%).