| Fire incidents reported |
|---|
| Sreet name | Count |
|---|
| WATER ST | 10 | | WATER ST | 10 | | MAIN ST | 8 | | 442 HWY | 6 | | CLARKSTOWN RD | 6 | | RAILROAD ST | 6 | | WASHINGTON ST | 6 | | 405 HWY | 4 | | BIDDLE RD | 4 | | BURNS RD | 4 | | CARPENTER | 4 | | DUTCHTOWN RD | 4 | | E WATER ST | 4 | | HARRISON RD | 4 | | LOWER RYNEARSON ROAD | 4 | | MARKET ST | 4 | | MUSSER LN | 4 | | PENN STREET | 4 | | PETER GRAY ROAD | 4 | | POND RD | 4 | | POND ROAD | 4 | | RABBITTOWN ROAD | 4 | | RTE 405 HWY | 4 | | SUSQUEHANNA TRL | 4 | | WASHINGTON ST | 4 |
| | | Fire incidents reported |
|---|
| Sreet name | Count |
|---|
| WOODLEY HOLLOW RD | 4 | | 400 RIDGE ROAD | 2 | | 864 HWY | 2 | | ALEXANDER DR | 2 | | ANTS HILL RD | 2 | | BILL SONES RD | 2 | | BILLSTONE RD | 2 | | BLOCK | 2 | | BUSH HOLLOW RD | 2 | | BUSH HOLLOW RD | 2 | | CHARLES RD | 2 | | CHESNUT STREET EXT | 2 | | CHESTNUT ST | 2 | | CLARKSTOWN RD | 2 | | CLARKSTOWN ROAD | 2 | | DAVIS LN | 2 | | DIGGAN RD | 2 | | EAST PENN STREET | 2 | | ELLIS ARTLEY RD | 2 | | EXCHANGE RD | 2 | | EXCHANGE ROAD | 2 | | FORESMAN LN | 2 | | GLADE RUN | 2 | | GLADE RUN RD | 2 | | HEATHERBROOK ESTATES | 2 |
|
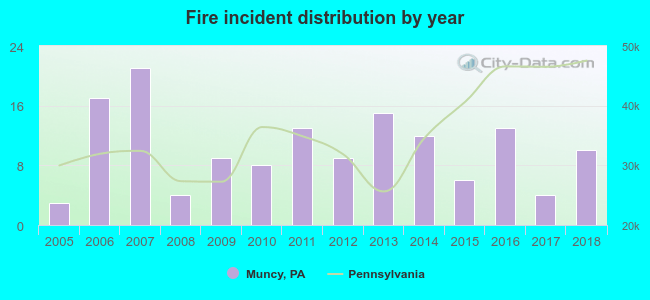 According to the data from the years 2005 - 2018 the average number of fire incidents per year is 10. The highest number of fire incidents - 21 took place in 2007, and the least - 3 in 2005. The data has a rising trend.
 27.1% incidents where reported in the morning and 72.9% in the evening. The most fires (17.4%) took place on Wednesday, and the least (6.9%) on Friday.
 According to the 144 fire incident reports from years 2005 - 2018 most fires (14.6%) took place during March, and the least (1.4%) in August.
 Out of all 399 cases reported during the years 2005 - 2018, the most belonged to the categories: Overpressure Rupture (46.4%), Fire (36.1%), and Service Call (7.3%).
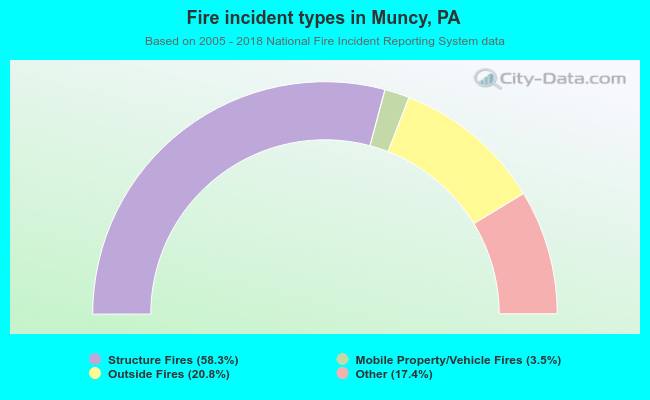 When looking into fire subcategories, the most reports belonged to: Structure Fires (58.3%), and Outside Fires (20.8%).