Mulga: Fire Incidents, Alabama (AL)
Where are fire incidents reported in Mulga, AL
Something went wrong! Please refresh the page.
|
| |||||||||||||||||||||||||||||||||||||||||||||||||||||||||||||||||||||||||||||||||||||||||||||||||||||||||||||
2004 - 2018 National Fire Incident Reporting System (NFIRS) incidents
- Incident types reported to NFIRS in Mulga, AL
- 20944.2%Rescue & EMS
- 16134.0%Fire
- 7415.6%Good Intent Call
- 153.2%Service Call
- 122.5%Hazardous Condition
- 10.2%False Alarm
- 10.2%Special Incident
- Fire incident types reported to NFIRS in Mulga, AL
- 10967.7%Structure Fires
- 4528.0%Outside Fires
- 63.7%Mobile Property/Vehicle Fires
- 10.6%Other
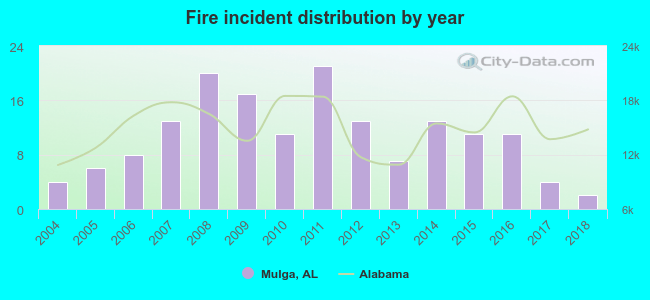 Based on the data from the years 2004 - 2018 the average number of fires per year is 11. The highest number of reported fire incidents - 21 took place in 2011, and the least - 2 in 2018. The data has a dropping trend.
 37.3% incidents where reported in the morning and 62.7% in the evening. The most fires (18.6%) took place on Friday, and the least (11.2%) on Tuesday.
 Based on the 161 fires from years 2004 - 2018 most fires (14.9%) took place during August, and the least (3.1%) in April.
 Out of all 473 cases reported during the years 2004 - 2018, the most belonged to the categories: Overpressure Rupture (44.2%), Fire (34.0%), and Service Call (15.6%).
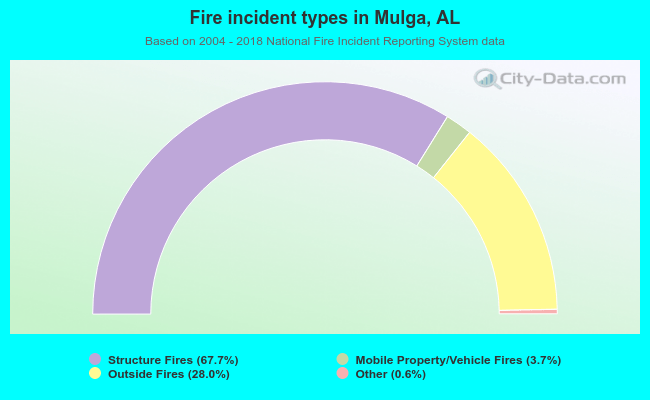 When looking into fire subcategories, the most incidents belonged to: Structure Fires (67.7%), and Outside Fires (28.0%).