| Fire incidents reported |
|---|
| Sreet name | Count |
|---|
| MULBERRY GROVE RD | 12 | | MINNESOTA AVE | 10 | | MISSOURI AVE | 10 | | CONOCO RD | 8 | | 100 AND 850 ROAD | 6 | | 1325 ROAD | 6 | | 70 | 6 | | INTERSTATE 70 | 6 | | MINNESOTA | 6 | | 313 EAST SOUTH ST | 4 | | 502 TAYLOR STREET | 4 | | ARKANSAS ST | 4 | | ARKANSAS STRE | 4 | | CHURCH | 4 | | COLORADO AVE | 4 | | COUNTY LINE RD | 4 | | GILHAM | 4 | | I-70 EXPY | 4 | | MICHIGAN AVE | 4 | | NEBRASKA AVE | 4 | | RT 2 BOX 233 | 4 | | SNOW CEMETARY | 4 | | TRAPPER AVE | 4 | | VIRGINIA AVE | 4 | | 000 E RD | 2 |
| | | Fire incidents reported |
|---|
| Sreet name | Count |
|---|
| 000 RD | 2 | | 100 E 1450 N | 2 | | 100 EAST AT 750 | 2 | | 100 EAST RD | 2 | | 100 ST | 2 | | 100N N OF PITTSBURG RD | 2 | | 101 PIERCE STREET | 2 | | 1024 MULBERRY GROVE ROAD | 2 | | 103 CHURCH ST | 2 | | 104 EAST SCHOOL STREET | 2 | | 104 S CHURCH | 2 | | 104 SCHOOL ST | 2 | | 104 SCHOOL STREET | 2 | | 108 N MAPLE | 2 | | 1095 CONOCO ROAD | 2 | | 1098 CONOCO RD | 2 | | 1100 150 E RD | 2 | | 1102 MG RD | 2 | | 1153 MICHIGAN AVE. | 2 | | 1161 HOLLY AVE | 2 | | 1164 MULBERRY GROVE ROAD | 2 | | 1169 NEBRASKA | 2 | | 118 MAPLE STREET | 2 | | 119 NORTH 6TH STREET | 2 | | |
|
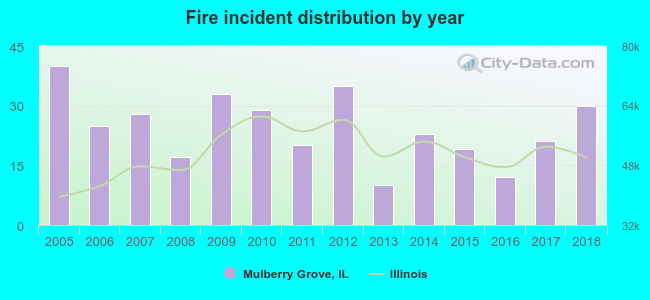 According to the data from the years 2005 - 2018 the average number of fires per year is 24. The highest number of fire incidents - 40 took place in 2005, and the least - 10 in 2013. The data has a decreasing trend.
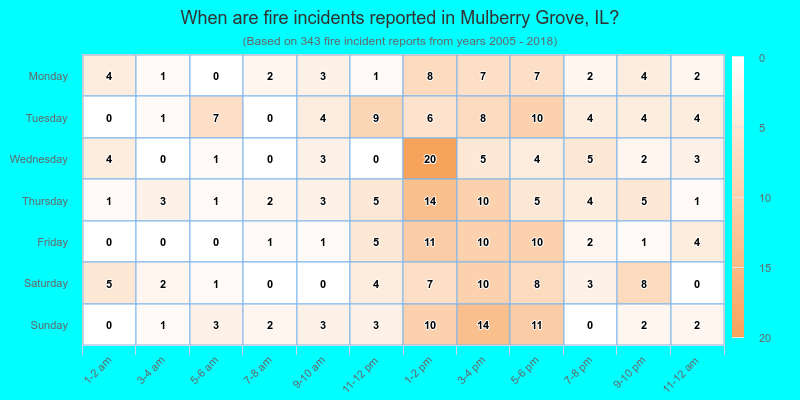
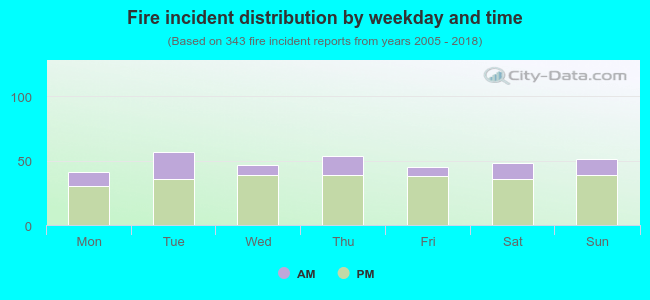 25.1% incidents where reported in the morning and 74.9% in the evening. The most fires (16.6%) took place on Tuesday, and the least (12.0%) on Monday.
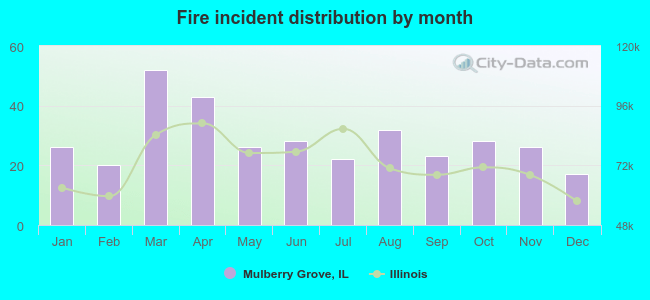 Based on the 343 fire incidents from years 2005 - 2018 most fires (15.2%) took place during March, and the least (5.0%) in December.
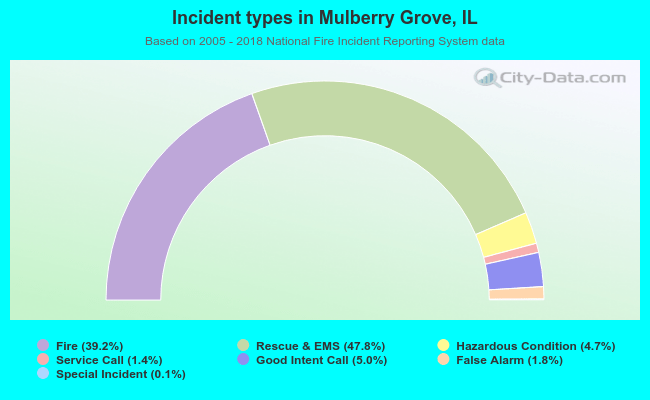 Out of all 876 cases reported during the years 2005 - 2018, the most belonged to the categories: Overpressure Rupture (47.8%), Fire (39.2%), and Service Call (5.0%).
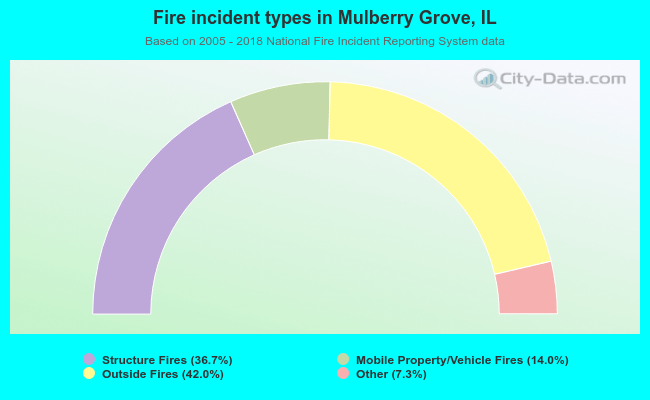 When looking into fire subcategories, the most incidents belonged to: Outside Fires (42.0%), and Structure Fires (36.7%).