Moweaqua: Fire Incidents, Illinois (IL)
Where are fire incidents reported in Moweaqua, IL
Something went wrong! Please refresh the page.
|
| |||||||||||||||||||||||||||||||||||||||||||||||||||||||||||||||||||||||||||||||||||||||||||||||||||||||||||||
| Other | 23 | |||||||||||||||||||||||||||||||||||||||||||||||||||||||||||||||||||||||||||||||||||||||||||||||||||||||||||||
2002 - 2018 National Fire Incident Reporting System (NFIRS) incidents
- Incident types reported to NFIRS in Moweaqua, IL
- 76662.3%Rescue & EMS
- 29724.2%Fire
- 695.6%False Alarm
- 362.9%Good Intent Call
- 282.3%Hazardous Condition
- 181.5%Service Call
- 110.9%Severe Weather
- 30.2%Special Incident
- Fire incident types reported to NFIRS in Moweaqua, IL
- 12843.1%Structure Fires
- 11940.1%Outside Fires
- 3913.1%Mobile Property/Vehicle Fires
- 113.7%Other
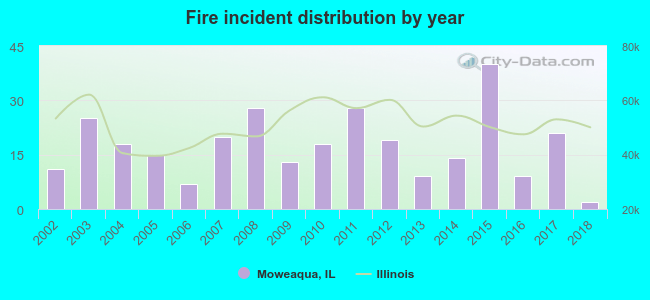 According to the data from the years 2002 - 2018 the average number of fires per year is 17. The highest number of fire incidents - 40 took place in 2015, and the least - 2 in 2018. The data has a decreasing trend.
 32.0% incidents where reported in the morning and 68.0% in the evening. The most fires (20.2%) took place on Sunday, and the least (9.4%) on Friday.
 Based on the 297 fire incidents from years 2002 - 2018 most fires (15.8%) took place during September, and the least (3.7%) in December.
 Out of all 1,229 cases reported during the years 2002 - 2018, the most belonged to the categories: Rescue & EMS (62.3%), Fire (24.2%), and False Alarm (5.6%).
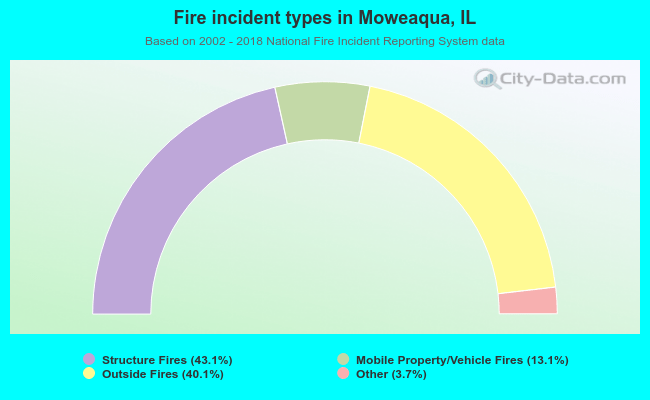 When looking into fire subcategories, the most incidents belonged to: Structure Fires (43.1%), and Outside Fires (40.1%).