Mound: Fire Incidents, Minnesota (MN)
Where are fire incidents reported in Mound, MN
Something went wrong! Please refresh the page.
|
| |||||||||||||||||||||||||||||||||||||||||||||||||||||||||||||||||||||||||||||||||||||||||||||||||||||||||||||
2002 - 2018 National Fire Incident Reporting System (NFIRS) incidents
- Incident types reported to NFIRS in Mound, MN
- 91132.1%Hazardous Condition
- 90331.8%Rescue & EMS
- 41014.4%Fire
- 31111.0%Good Intent Call
- 1906.7%False Alarm
- 1063.7%Service Call
- 40.1%Overpressure Rupture
- 30.1%Severe Weather
- Fire incident types reported to NFIRS in Mound, MN
- 19046.3%Structure Fires
- 11427.8%Outside Fires
- 6415.6%Mobile Property/Vehicle Fires
- 4210.2%Other
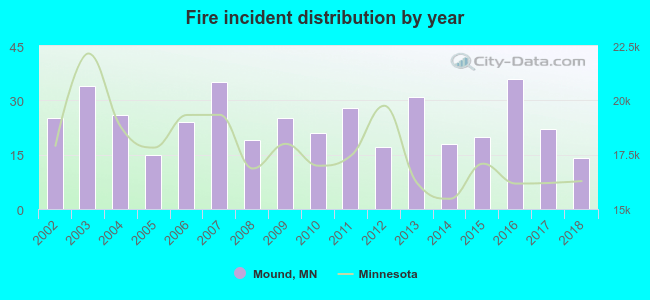 Based on the data from the years 2002 - 2018 the average number of fires per year is 24. The highest number of reported fires - 36 took place in 2016, and the least - 14 in 2018. The data has a declining trend.
The average number of yearly fire incidents per 10k residents in Mound, MN compared to nearest cities:
(Note: Based on data for the last 3 years, including only cities with population 5,000 and above)
| Mound: | 25.8 |
| Minnetrista: | 20.3 |
| Orono: | 19.0 |
| Shorewood: | 10.6 |
| Victoria: | 14.3 |
| Chanhassen: | 11.3 |
| Medina: | 22.3 |
| Waconia: | 17.6 |
| Chaska: | 13.6 |
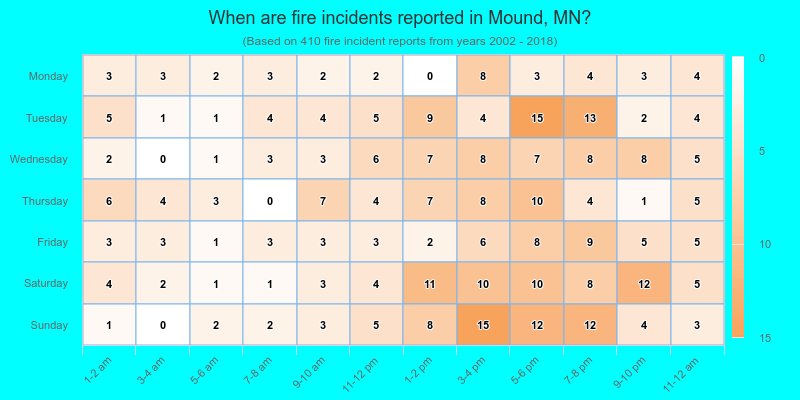
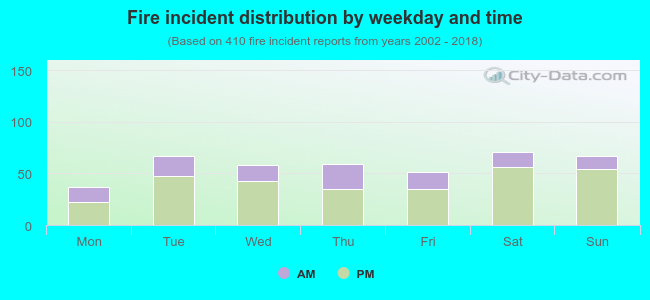 28.8% incidents where reported in the morning and 71.2% in the evening. The most fires (17.3%) took place on Saturday, and the least (9.0%) on Monday.
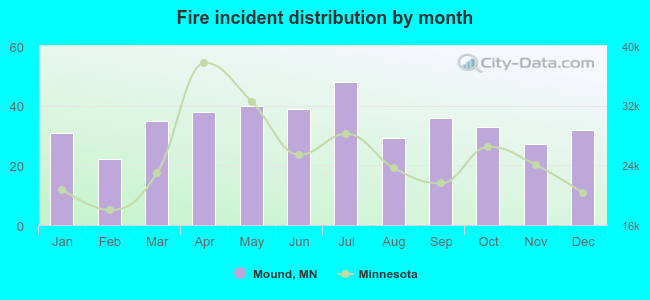 Based on the 410 fires from years 2002 - 2018 most fires (11.7%) took place during July, and the least (5.4%) in February.
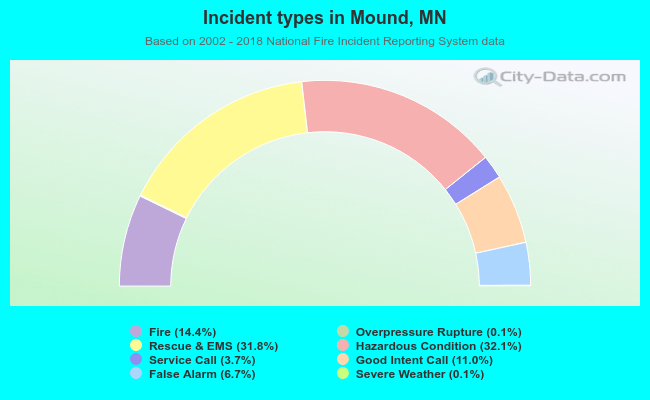 Out of all 2,838 cases reported during the years 2002 - 2018, the most belonged to the categories: Hazardous Condition (32.1%), Rescue & EMS (31.8%), and Fire (14.4%).
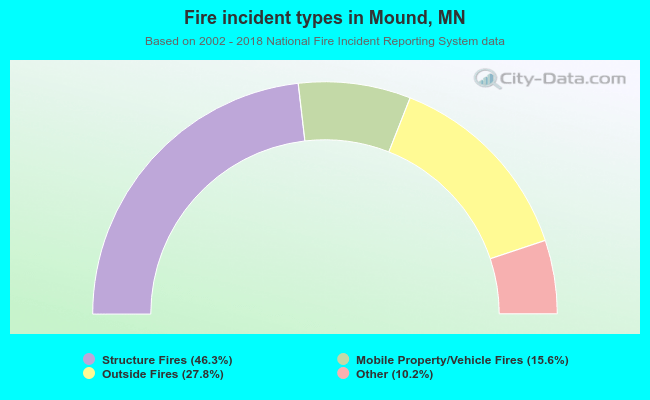 When looking into fire subcategories, the most incidents belonged to: Structure Fires (46.3%), and Outside Fires (27.8%).