Morristown: Fire Incidents, New Jersey (NJ)
Where are fire incidents reported in Morristown, NJ
Something went wrong! Please refresh the page.
| Fire incidents reported | |
|---|---|
| Sreet name | Count |
| EARLY ST | 620 |
| SPEEDWELL AVE | 266 |
| MADISON AVE | 174 |
| ANN ST | 170 |
| SOUTH ST | 154 |
| MORRIS ST | 130 |
| FLAGLER ST | 98 |
| HANOVER AVE | 68 |
| RT 287 | 68 |
| WASHINGTON ST | 62 |
| MARTIN LUTHER KING AVE | 58 |
| RIDGEDALE AVE | 58 |
| AIRPORT RD | 56 |
| SUSSEX AVE | 54 |
| PARK PL | 46 |
| ELM ST | 44 |
| LAFAYETTE AVE | 42 |
| WESTERN AVE | 38 |
| MT. KEMBLE AVE | 34 |
| CONVENT RD | 30 |
| FRANKLIN ST | 28 |
| ABBETT AVE | 26 |
| PARK AVE | 26 |
| PINE ST | 26 |
| COLUMBIA RD | 22 |
| LAKE RD | 22 |
| RAYNOR RD | 22 |
| SPRING PL | 22 |
| SPRING ST | 22 |
| CLYDE POTTS DR | 20 |
2003 - 2018 National Fire Incident Reporting System (NFIRS) incidents
- Incident types reported to NFIRS in Morristown, NJ
- 4,94927.0%False Alarm
- 4,69525.6%Hazardous Condition
- 3,51919.2%Rescue & EMS
- 2,16011.8%Fire
- 1,2616.9%Good Intent Call
- 1,2536.8%Service Call
- 3802.1%Overpressure Rupture
- 850.5%Severe Weather
- 310.2%Special Incident
- Fire incident types reported to NFIRS in Morristown, NJ
- 1,33161.6%Structure Fires
- 51523.8%Outside Fires
- 27812.9%Mobile Property/Vehicle Fires
- 361.7%Other
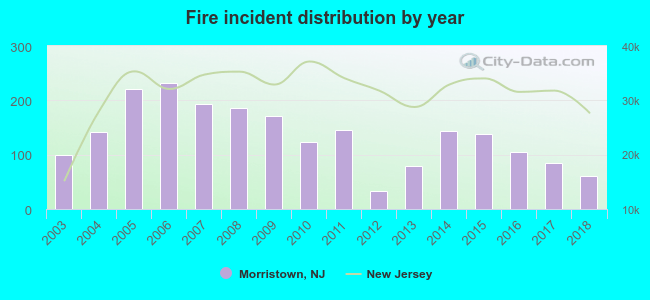 Based on the data from the years 2003 - 2018 the average number of fires per year is 135. The highest number of fire incidents - 231 took place in 2006, and the least - 34 in 2012. The data has a dropping trend.
The average number of yearly fire incidents per 10k residents in Morristown, NJ compared to nearest cities:
(Note: Based on data for the last 3 years, including only cities with population 5,000 and above)
| Morristown: | 43.7 |
| Morris Plains: | 79.7 |
| Madison: | 14.5 |
| Florham Park: | 15.2 |
| Chatham: | 42.1 |
| Rockaway: | 57.6 |
| Dover: | 64.8 |
| Bernardsville: | 26.6 |
| New Providence: | 16.9 |
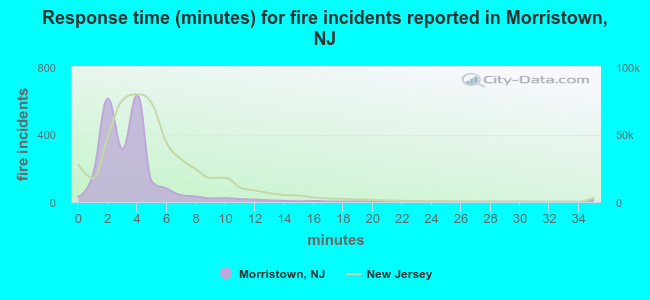 The median response time based on all reported fire incidents is 3 minutes. This is lower than the New Jersey median value.
The median response time in Morristown, NJ compared to nearest cities:
(Note: Based on data for all years, including only cities with at least 500 fire incidents)
| Morristown: | 3 minutes |
| Morris Plains: | 4 minutes |
| Rockaway: | 8 minutes |
| Dover: | 3 minutes |
| Livingston: | 0 minutes |
| Summit: | 5 minutes |
| Short Hills: | 5 minutes |
| Berkeley Heights: | 5 minutes |
| Millburn: | 4 minutes |
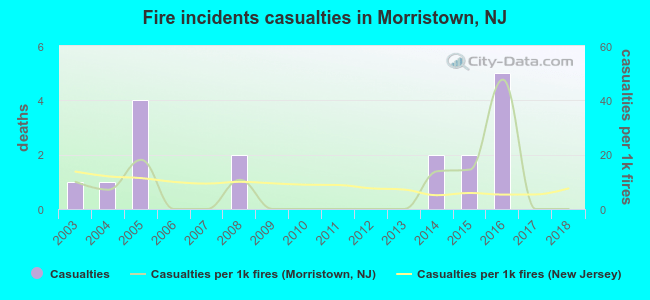 Based on the data from the years 2003 - 2018 the average number of fire-related yearly casualties is 1. The highest number of injuries - 5 took place in 2016, and the lowest - 0 in 2006. The data has a dropping trend.
The average number of injuries per 1,000 fire incidents is 8. This indicator was the highest - 48 in 2016, and the lowest 0 in 2006. The trend for casualties per 1,000 fire incidents is decreasing. Compared to the New Jersey value the number of injuries per 1,000 incidents is similar.
Based on the data from the years 2003 - 2018 the average number of fire-related yearly casualties is 1. The highest number of injuries - 5 took place in 2016, and the lowest - 0 in 2006. The data has a dropping trend.
The average number of injuries per 1,000 fire incidents is 8. This indicator was the highest - 48 in 2016, and the lowest 0 in 2006. The trend for casualties per 1,000 fire incidents is decreasing. Compared to the New Jersey value the number of injuries per 1,000 incidents is similar.Casualties per 1,000 incidents in Morristown, NJ compared to nearest cities:
(Note: Based on data for all years, including only cities with at least 500 fire incidents)
| Morristown: | 7.9 |
| Morris Plains: | 1.5 |
| Rockaway: | 9.2 |
| Dover: | 10.4 |
| Livingston: | 5.2 |
| Summit: | 15.8 |
| Short Hills: | 7.0 |
| Berkeley Heights: | 19.2 |
| Millburn: | 6.9 |
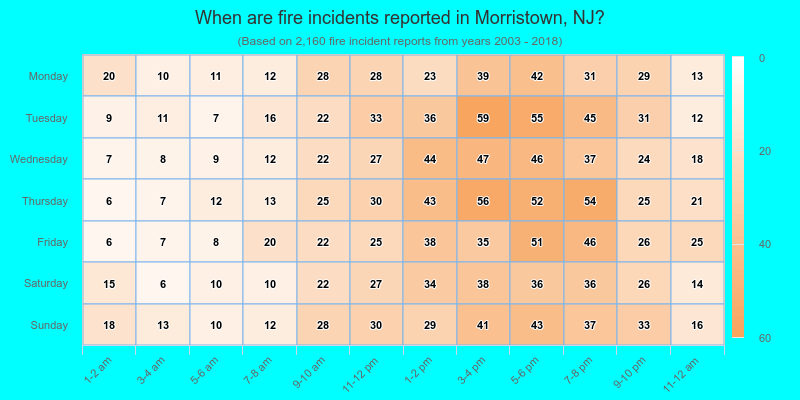
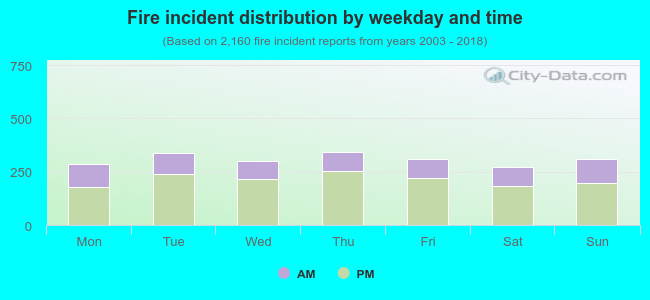 31.2% incidents where reported in the morning and 68.8% in the evening. The most fires (15.9%) took place on Thursday, and the least (12.7%) on Saturday.
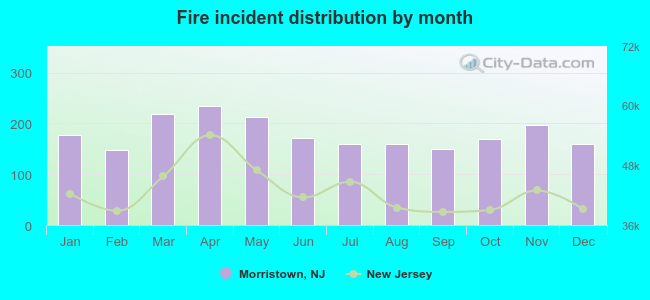 According to the 2,160 fires from years 2003 - 2018 most fires (10.9%) took place during April, and the least (6.9%) in February.
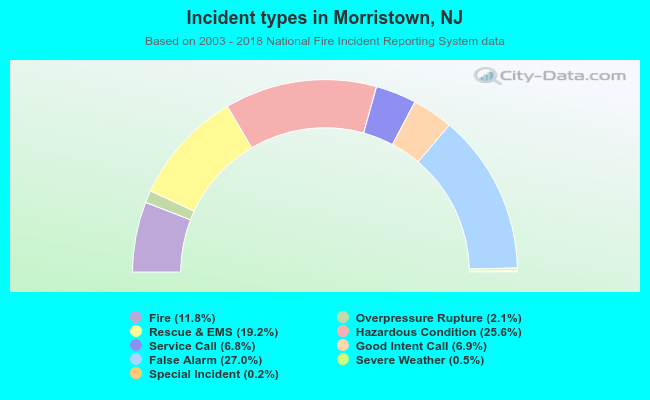 Out of all 18,333 cases reported during the years 2003 - 2018, the most belonged to the categories: False Alarm (27.0%), Hazardous Condition (25.6%), and Rescue & EMS (19.2%).
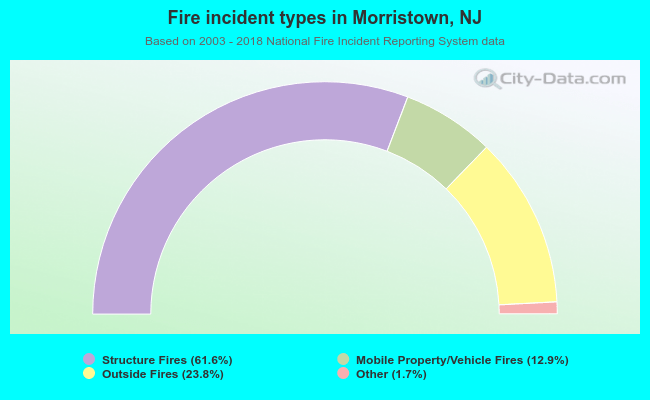 When looking into fire subcategories, the most reports belonged to: Structure Fires (61.6%), and Outside Fires (23.8%).