| Fire incidents reported |
|---|
| Sreet name | Count |
|---|
| 139 330TH ROAD | 4 | | 150 320TH | 4 | | 210 HWY K 246 | 4 | | 349TH HAZELNUT | 4 | | FANNING ST | 4 | | K246 | 4 | | 100 HANSON ST | 2 | | 1000 280TH ROAD | 2 | | 102 VIRGINIA | 2 | | 1031 340 RD | 2 | | 1043 390TH ROAD | 2 | | 1103 300TH STREET | 2 | | 1105 280TH RD | 2 | | 1112 280TH ROAD RT | 2 | | 1263 310TH STREET | 2 | | 150 330TH ROAD | 2 | | 170 330TH ROAD | 2 | | 175 320TH RD | 2 | | 200 COTTONWOOD STREET | 2 | | 202 ROXANNA | 2 | | 202 ROXANNA ST | 2 | | 205 330TH ROAD | 2 | | 250 BITTERSWEET RD | 2 | | 250 HWY K246 | 2 | | 290 BITTERSWEET RD | 2 |
| | | Fire incidents reported |
|---|
| Sreet name | Count |
|---|
| 2900 DEWBERRY RD | 2 | | 290TH | 2 | | 2950 DEWBERRY RD ALY | 2 | | 300 320TH | 2 | | 300 BITTERSWEET RD | 2 | | 310 GOLDFINCH | 2 | | 3162 JACKRABBIT ROAD | 2 | | 320TH AND GOLDFINCH | 2 | | 320TH LGTS | 2 | | 3400 HORNED OWL RD | 2 | | 365 HWY K246 | 2 | | 3885 GOLDFINCH RD | 2 | | 400 320TH | 2 | | 401 CHICKADEE RD | 2 | | 406 MAIN | 2 | | 408 FANNING STREET | 2 | | 425 290TH RD | 2 | | 475 290TH ROAD | 2 | | 500 290TH | 2 | | 525 HWY K246 | 2 | | 526 290TH STREET | 2 | | 600 330TH STREET | 2 | | 727 310TH RD | 2 | | 904 310TH RD | 2 | | |
|
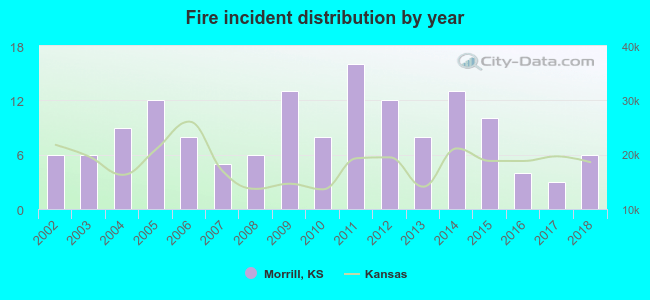 Based on the data from the years 2002 - 2018 the average number of fires per year is 9. The highest number of fire incidents - 16 took place in 2011, and the least - 3 in 2017. The data has a constant trend.
 24.1% incidents where reported in the morning and 75.9% in the evening. The most fires (19.3%) took place on Wednesday, and the least (9.0%) on Sunday.
 Based on the 145 incident reports from years 2002 - 2018 most fires (18.6%) took place during March, and the least (2.8%) in June.
 Out of all 193 cases reported during the years 2002 - 2018, the most belonged to the categories: Fire (75.1%), Rescue & EMS (10.9%), and Hazardous Condition (7.3%).
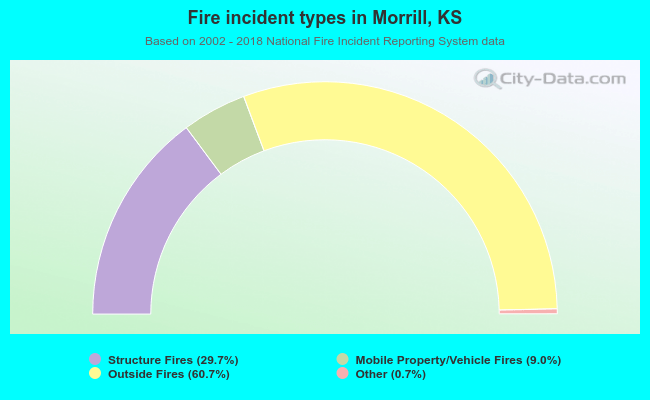 When looking into fire subcategories, the most incidents belonged to: Outside Fires (60.7%), and Structure Fires (29.7%).