Morgantown: Fire Incidents, West Virginia (WV)
Where are fire incidents reported in Morgantown, WV
Something went wrong! Please refresh the page.
| Fire incidents reported | |
|---|---|
| Sreet name | Count |
| UNIVERSITY AVE | 258 |
| GRANT AVE | 220 |
| BEVERLY AVE | 210 |
| BEECHURST AVE | 180 |
| SPRUCE ST | 118 |
| MCLANE AVE | 116 |
| HIGH ST | 108 |
| WILLEY ST | 108 |
| INTERSTATE 68 | 106 |
| MCLANE ALY | 104 |
| I68 | 102 |
| PENNSYLVANIA AVE | 102 |
| EARL L CORE RD | 98 |
| POINT MARION RD | 92 |
| KINGWOOD PIKE | 88 |
| THIRD ST | 84 |
| GRAFTON RD | 76 |
| SMITHTOWN RD | 74 |
| VAN VOORHIS RD | 72 |
| VENTURE DR | 72 |
| FAIRCHANCE RD | 68 |
| STEWARTSTOWN RD | 68 |
| DON KNOTTS BLVD | 66 |
| MILEGROUND RD | 66 |
| I-68 | 60 |
| STEWART ST | 60 |
| I79 | 58 |
| JONES AVE | 58 |
| SMITHTOWN RD | 56 |
| CHESTNUT RIDGE RD | 54 |
| Other | 4,473 |
2003 - 2018 National Fire Incident Reporting System (NFIRS) incidents
- Incident types reported to NFIRS in Morgantown, WV
- 10,30125.9%Good Intent Call
- 8,65721.7%Rescue & EMS
- 7,71319.4%Hazardous Condition
- 7,47518.8%Fire
- 3,5979.0%False Alarm
- 1,8564.7%Service Call
- 1930.5%Severe Weather
- Fire incident types reported to NFIRS in Morgantown, WV
- 3,34044.7%Structure Fires
- 2,74936.8%Outside Fires
- 1,09014.6%Mobile Property/Vehicle Fires
- 2964.0%Other
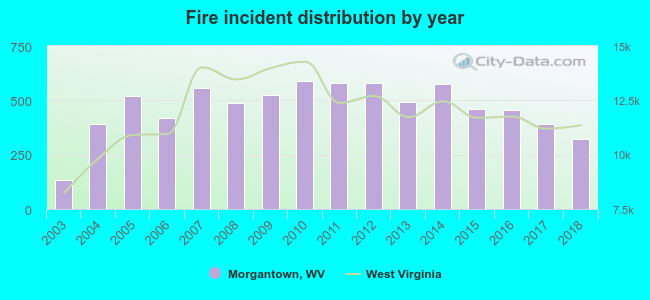 According to the data from the years 2003 - 2018 the average number of fires per year is 467. The highest number of fires - 588 took place in 2010, and the least - 133 in 2003. The data has a growing trend.
The average number of yearly fire incidents per 10k residents in Morgantown, WV compared to nearest cities:
(Note: Based on data for the last 3 years, including only cities with population 5,000 and above)
| Morgantown: | 125.2 |
| Brookhaven: | 4.5 |
| Cheat Lake: | 2.1 |
| Fairmont: | 80.2 |
| Grafton: | 132.1 |
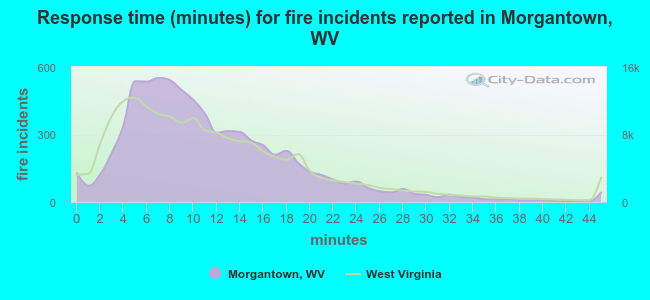 The median response time based on all reported fire incidents is 10 minutes. This is similar to the state median value.
The median response time in Morgantown, WV compared to nearest cities:
(Note: Based on data for all years, including only cities with at least 500 fire incidents)
| Morgantown: | 10 minutes |
| Fairmont: | 9 minutes |
| Grafton: | 10 minutes |
| Uniontown: | 4 minutes |
| Waynesburg: | 6 minutes |
| Shinnston: | 11 minutes |
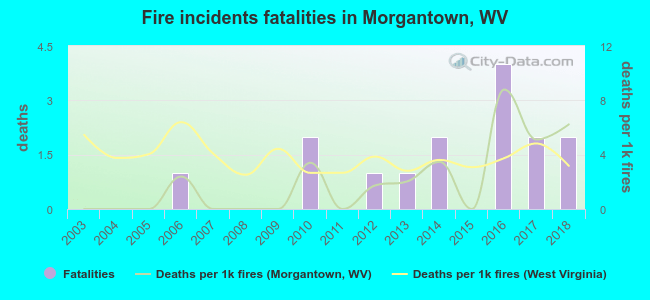 According to the data from the years 2003 - 2018 the average number of fire-related fatalities per year is 1. The highest number of reported deaths - 4 took place in 2016, and the lowest - 0 in 2003. The data has a rising trend.
The average number of fatalities per 1,000 fires is 2. This indicator was the highest - 9 in 2016, and the lowest 0 in 2003. The trend for fatalities per 1,000 incidents is growing. Compared to the West Virginia value the number of fatalities per 1,000 fire incidents is lower.
According to the data from the years 2003 - 2018 the average number of fire-related fatalities per year is 1. The highest number of reported deaths - 4 took place in 2016, and the lowest - 0 in 2003. The data has a rising trend.
The average number of fatalities per 1,000 fires is 2. This indicator was the highest - 9 in 2016, and the lowest 0 in 2003. The trend for fatalities per 1,000 incidents is growing. Compared to the West Virginia value the number of fatalities per 1,000 fire incidents is lower.Deaths per 1,000 incidents in Morgantown, WV compared to nearest cities:
(Note: Based on data for all years, including only cities with at least 2,500 fire incidents)
| Morgantown: | 2.0 |
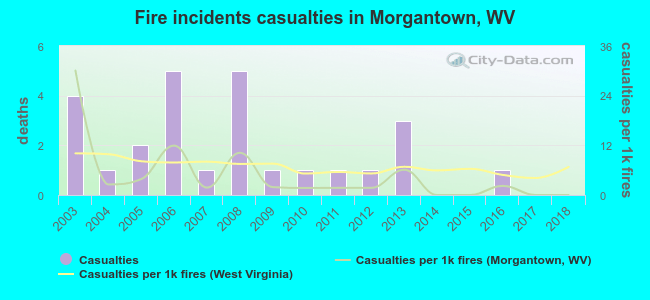 Based on the data from the years 2003 - 2018 the average number of fire-related yearly casualties is 2. The highest number of casualties - 5 took place in 2006, and the lowest - 0 in 2014. The data has a declining trend.
The average number of casualties per 1,000 fires is 5. This indicator was the highest - 30 in 2003, and the lowest 0 in 2014. The trend for casualties per 1,000 incidents is dropping. Compared to the state value the number of injuries per 1,000 fires is lower.
Based on the data from the years 2003 - 2018 the average number of fire-related yearly casualties is 2. The highest number of casualties - 5 took place in 2006, and the lowest - 0 in 2014. The data has a declining trend.
The average number of casualties per 1,000 fires is 5. This indicator was the highest - 30 in 2003, and the lowest 0 in 2014. The trend for casualties per 1,000 incidents is dropping. Compared to the state value the number of injuries per 1,000 fires is lower.Casualties per 1,000 incidents in Morgantown, WV compared to nearest cities:
(Note: Based on data for all years, including only cities with at least 500 fire incidents)
| Morgantown: | 3.5 |
| Fairmont: | 9.4 |
| Grafton: | 16.9 |
| Uniontown: | 7.2 |
| Waynesburg: | 14.9 |
| Shinnston: | 3.5 |
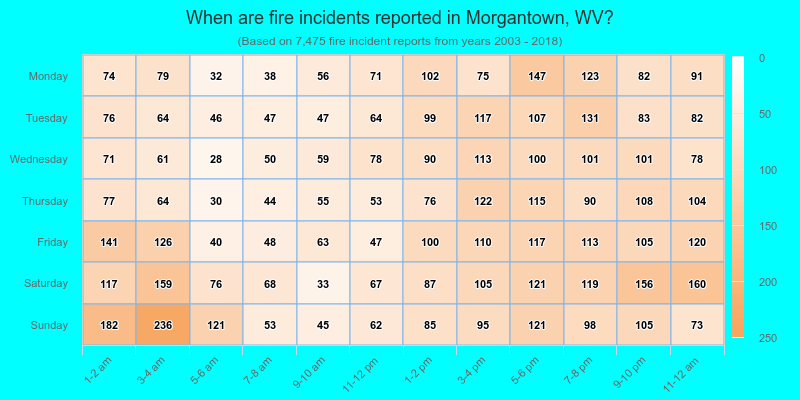
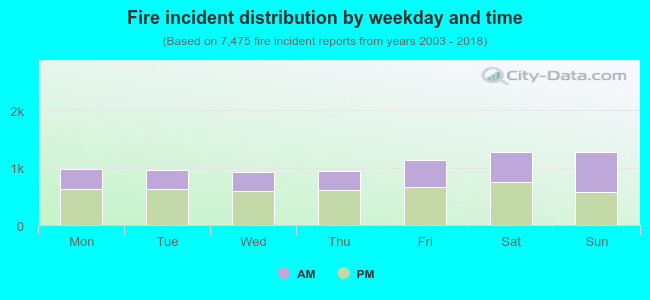 40.8% incidents where reported in the morning and 59.2% in the evening. The most fires (17.1%) took place on Sunday, and the least (12.4%) on Wednesday.
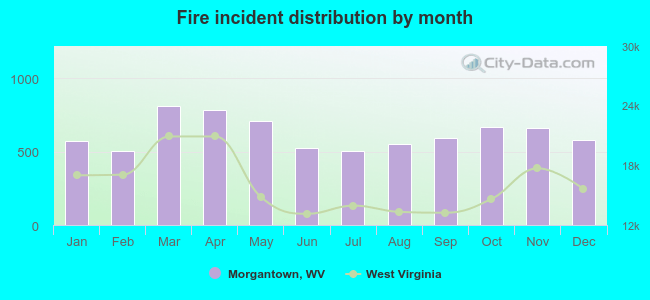 According to the 7,475 incident reports from years 2003 - 2018 most fires (10.9%) took place during March, and the least (6.8%) in February.
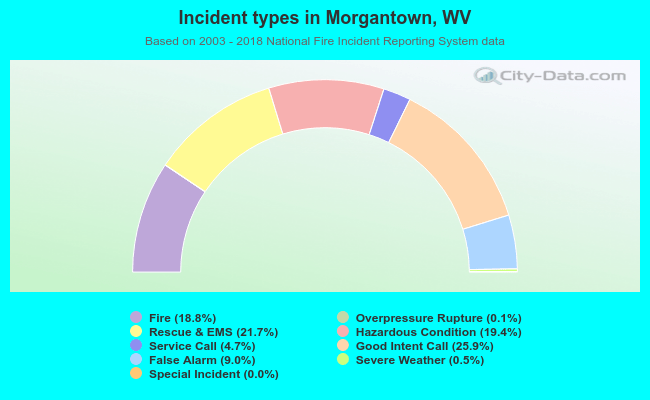 Out of all 39,833 cases reported during the years 2003 - 2018, the most belonged to the categories: Good Intent Call (25.9%), Rescue & EMS (21.7%), and Hazardous Condition (19.4%).
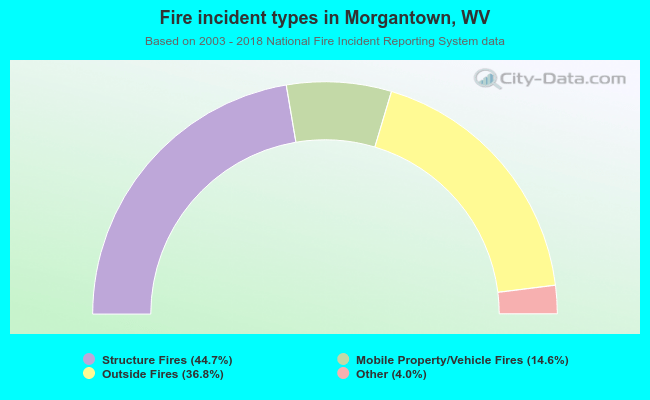 When looking into fire subcategories, the most reports belonged to: Structure Fires (44.7%), and Outside Fires (36.8%).