Morenci: Fire Incidents, Michigan (MI)
Where are fire incidents reported in Morenci, MI
Something went wrong! Please refresh the page.
|
| |||||||||||||||||||||||||||||||||||||||||||||||||||||||||||||||||||||||||||||||||||||||||||||||||||||||||||||
2002 - 2018 National Fire Incident Reporting System (NFIRS) incidents
- Incident types reported to NFIRS in Morenci, MI
- 46236.6%Hazardous Condition
- 32826.0%Fire
- 23518.6%Rescue & EMS
- 876.9%Service Call
- 766.0%Good Intent Call
- 413.3%Severe Weather
- 262.1%False Alarm
- 60.5%Special Incident
- Fire incident types reported to NFIRS in Morenci, MI
- 15246.3%Outside Fires
- 12337.5%Structure Fires
- 3410.4%Mobile Property/Vehicle Fires
- 195.8%Other
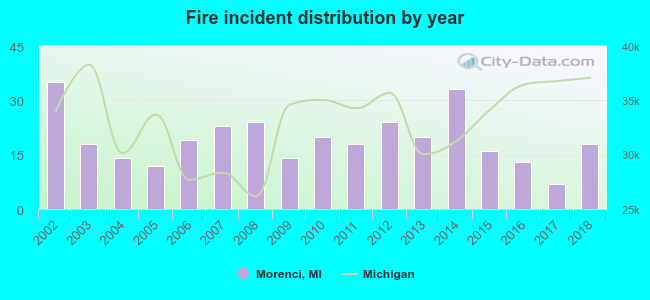 Based on the data from the years 2002 - 2018 the average number of fires per year is 19. The highest number of reported fires - 35 took place in 2002, and the least - 7 in 2017. The data has a decreasing trend.
 27.4% incidents where reported in the morning and 72.6% in the evening. The most fires (16.8%) took place on Monday, and the least (10.4%) on Wednesday.
 Based on the 328 reports from years 2002 - 2018 most fires (15.9%) took place during July, and the least (4.6%) in September.
 Out of all 1,261 cases reported during the years 2002 - 2018, the most belonged to the categories: Rescue & EMS (36.6%), Fire (26.0%), and Overpressure Rupture (18.6%).
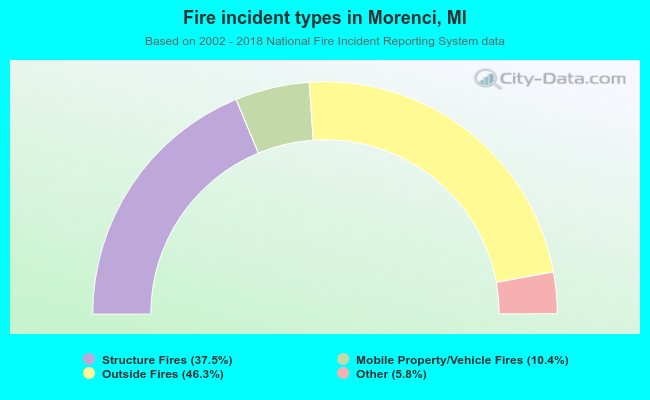 When looking into fire subcategories, the most reports belonged to: Outside Fires (46.3%), and Structure Fires (37.5%).