| Fire incidents reported |
|---|
| Sreet name | Count |
|---|
| CR 455 | 30 | | FLORIDA TPKE | 22 | | SUGAR BERRY LN | 18 | | FOSGATE RD | 16 | | PALM DR | 16 | | 7TH ST | 14 | | ELDERBERRY DR | 14 | | SEVENTH ST | 14 | | LAKESIDE DR | 12 | | FLORIDA TURNPIKE MM275 | 10 | | APPLE RD | 8 | | ARABIAN WAY | 8 | | BLACKSTILL LAKE RD | 8 | | FLORIDA TURNPIKE MM276 | 8 | | THOROUGHBRED LN | 8 | | TURNPIKE | 8 | | 455 COUNTY RD ROAD | 6 | | ELDERBERRY CT | 6 | | FLORIDA TURNPIKE MM278 | 6 | | FLORIDA TURNPIKE MM279 | 6 | | MAGNOLIA BLUFF DR | 6 | | PARK LN | 6 | | PORTER AVE | 6 | | VETTA DR | 6 | | VISTA BELLE CT | 6 |
| | | Fire incidents reported |
|---|
| Sreet name | Count |
|---|
| 3RD ST | 4 | | 7TH STREET | 4 | | BAY AV | 4 | | BAY AVE | 4 | | BOLSENA DR | 4 | | C.R. 455 | 4 | | CR 455 HWY | 4 | | CR455 | 4 | | DIVISION ST | 4 | | EVE DR | 4 | | FLORIDA TURNPIKE | 4 | | FLORIDA TURNPIKE MM277 | 4 | | FOSGATE ROAD | 4 | | KIRKLAND RD | 4 | | LOWRY RD | 4 | | MAGNOLIA CREEK LN | 4 | | OMEGA CT | 4 | | OSGOOD RD | 4 | | PALM VIEW AVE | 4 | | PENDIO DR | 4 | | RIDGEWOOD AVE | 4 | | SUGAR PINE WAY | 4 | | VINOLA DR | 4 | | WINTER RD | 4 | | |
|
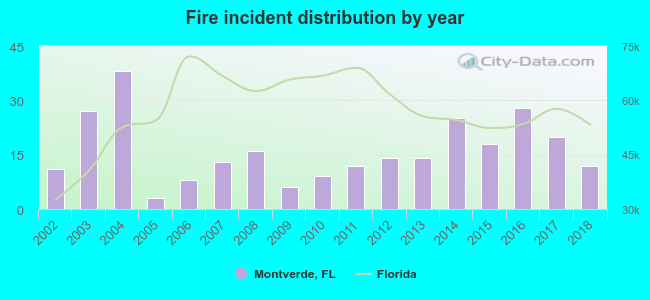 Based on the data from the years 2002 - 2018 the average number of fire incidents per year is 16. The highest number of reported fire incidents - 38 took place in 2004, and the least - 3 in 2005. The data has a growing trend.
 23.7% incidents where reported in the morning and 76.3% in the evening. The most fires (17.5%) took place on Friday, and the least (11.3%) on Monday.
 According to the 274 fire incidents from years 2002 - 2018 most fires (12.8%) took place during December, and the least (4.4%) in August.
 Out of all 2,607 cases reported during the years 2002 - 2018, the most belonged to the categories: Rescue & EMS (54.2%), Good Intent Call (10.6%), and Fire (10.5%).
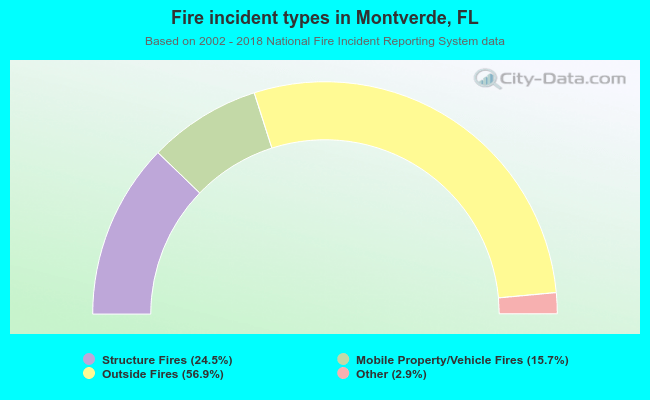 When looking into fire subcategories, the most reports belonged to: Outside Fires (56.9%), and Structure Fires (24.5%).