| Fire incidents reported |
|---|
| Sreet name | Count |
|---|
| STATE ROUTE 29 | 14 | | SR 29 RT | 12 | | LAKE AVE | 8 | | STATE ROUTE 706 | 8 | | 267 RT | 6 | | HART RD | 6 | | MAIN ST | 6 | | NORTH RD | 6 | | PARK ST | 6 | | SR 267 | 6 | | SR 3023 | 6 | | SR 706 | 6 | | TURNPIKE RD | 6 | | CHURCH ST | 4 | | DEVINE RIDGE ROAD | 4 | | FORKS HILL RD | 4 | | LAUREL ST | 4 | | MESHOPPEN CREEK RD | 4 | | MITCHELL HL | 4 | | OLD COUNTY RD | 4 | | PROSPECT HILL RD | 4 | | PUBLIC AVE | 4 | | RIDGE RD | 4 | | S MAIN ST | 4 | | SOUTH MAIN ST | 4 |
| | | Fire incidents reported |
|---|
| Sreet name | Count |
|---|
| SR 3023 SR | 4 | | SR3001 SR | 4 | | STATE ROUTE 267 | 4 | | STATE ROUTE 3001 | 4 | | 1412 OLD COUNTY ROAD ST | 2 | | 183 FAIRGROUNDS RD | 2 | | 300 SOUTH MAIN STREET ST | 2 | | 3119 SILVER CREEK ROAD | 2 | | 4015 RT | 2 | | 449 SOUTH MAIN ST | 2 | | 4837 SR 706 | 2 | | 560 SPROUT ROAD | 2 | | 706 RT | 2 | | 966 FERNHEIM ROAD | 2 | | BABCOCK RD | 2 | | BANK ST | 2 | | BARE VALLEY RD | 2 | | BARE VALLEY ROAD | 2 | | BEAVER RUN RD | 2 | | BEEBE HOLLOW RD | 2 | | BEEBE HOLLOW RD | 2 | | BINGHAMTON ROAD | 2 | | BLAISURE RD | 2 | | BOOTH RD | 2 | | |
|
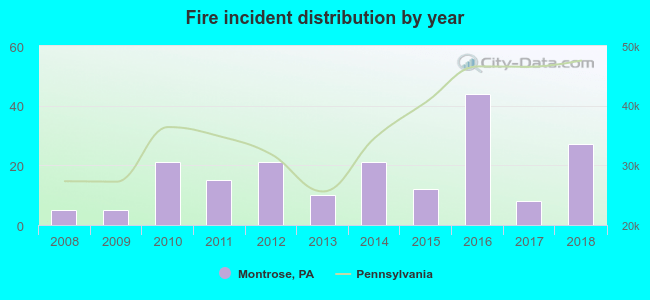 According to the data from the years 2008 - 2018 the average number of fire incidents per year is 17. The highest number of fires - 44 took place in 2016, and the least - 5 in 2008. The data has a growing trend.
 26.5% incidents where reported in the morning and 73.5% in the evening. The most fires (19.6%) took place on Saturday, and the least (9.0%) on Wednesday.
 Based on the 189 fire incident reports from years 2008 - 2018 most fires (19.6%) took place during April, and the least (2.1%) in August.
 Out of all 740 cases reported during the years 2008 - 2018, the most belonged to the categories: Overpressure Rupture (29.5%), Fire (25.5%), and Rescue & EMS (22.6%).
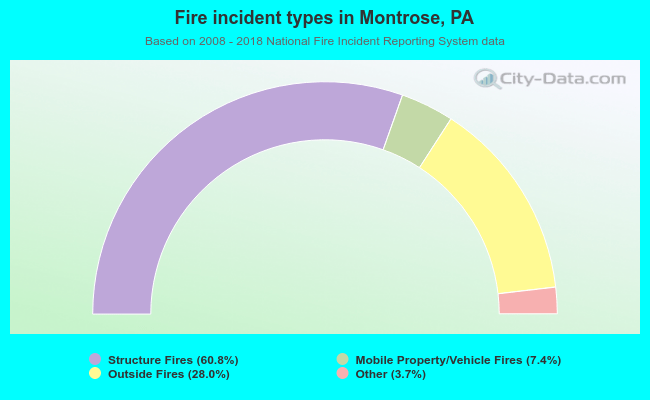 When looking into fire subcategories, the most incidents belonged to: Structure Fires (60.8%), and Outside Fires (28.0%).