Montrose: Fire Incidents, Colorado (CO)
Where are fire incidents reported in Montrose, CO
Something went wrong! Please refresh the page.
| Fire incidents reported | |
|---|---|
| Sreet name | Count |
| TOWNSEND AVE | 266 |
| HIGHWAY 550 | 162 |
| MAIN ST | 154 |
| HIGHWAY 50 | 94 |
| SPRING CREEK RD | 94 |
| 6450 RD | 88 |
| CHIPETA DR | 88 |
| OAK GROVE RD | 86 |
| 6530 RD | 82 |
| HIGHWAY 90 | 74 |
| LASALLE RD | 70 |
| MARINE DR | 60 |
| 3RD ST | 54 |
| 5TH ST | 54 |
| UNCOMPAHGRE RD | 52 |
| 6400 RD | 46 |
| MIAMI RD | 46 |
| 2ND ST | 42 |
| LOCUST RD | 42 |
| 6100 RD | 40 |
| BUCKHORN RD | 40 |
| LANDFILL RD | 40 |
| SAN JUAN AVE | 38 |
| GRAND AVE | 36 |
| 6250 RD | 34 |
| 6300 RD | 34 |
| OGDEN RD | 32 |
| 12TH ST | 30 |
| 1ST ST | 30 |
| 4TH ST | 30 |
| Other | 549 |
2002 - 2018 National Fire Incident Reporting System (NFIRS) incidents
- Incident types reported to NFIRS in Montrose, CO
- 10,29257.0%Rescue & EMS
- 2,58714.3%Fire
- 1,7329.6%Hazardous Condition
- 1,3597.5%Good Intent Call
- 1,0425.8%Service Call
- 1,0005.5%False Alarm
- 220.1%Special Incident
- Fire incident types reported to NFIRS in Montrose, CO
- 1,47457.0%Outside Fires
- 79630.8%Structure Fires
- 28210.9%Mobile Property/Vehicle Fires
- 351.4%Other
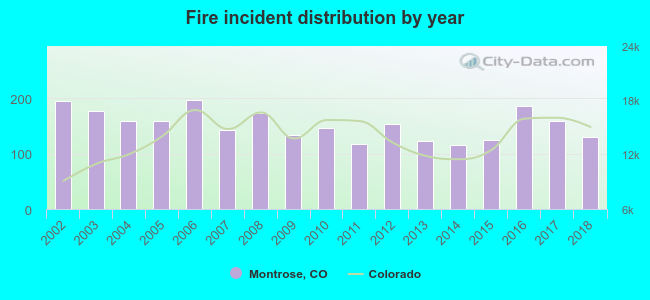 Based on the data from the years 2002 - 2018 the average number of fire incidents per year is 152. The highest number of fires - 196 took place in 2006, and the least - 116 in 2014. The data has a decreasing trend.
The average number of yearly fire incidents per 10k residents in Montrose, CO compared to nearest cities:
(Note: Based on data for the last 3 years, including only cities with population 5,000 and above)
| Montrose: | 83.0 |
| Delta: | 26.4 |
| Gunnison: | 17.9 |
| Clifton: | 26.1 |
| Grand Junction: | 49.1 |
| Fruita: | 55.4 |
| Carbondale: | 44.6 |
| Rifle: | 44.3 |
| Aspen: | 23.5 |
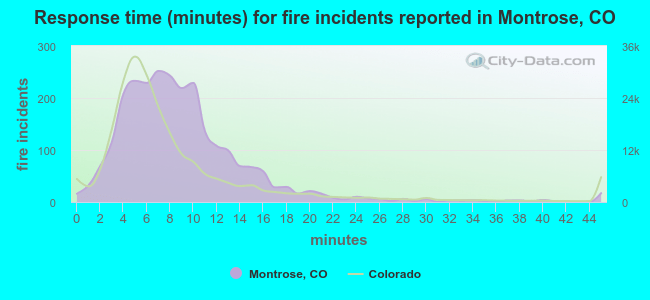 The median response time based on all reported fire incidents is 8 minutes. This is higher than the state median value.
The median response time in Montrose, CO compared to nearest cities:
(Note: Based on data for all years, including only cities with at least 500 fire incidents)
| Montrose: | 8 minutes |
| Hotchkiss: | 10 minutes |
| Clifton: | 6 minutes |
| Grand Junction: | 7 minutes |
| Fruita: | 11 minutes |
| Parachute: | 11 minutes |
| Carbondale: | 8 minutes |
| Rifle: | 11 minutes |
| Glenwood Springs: | 7 minutes |
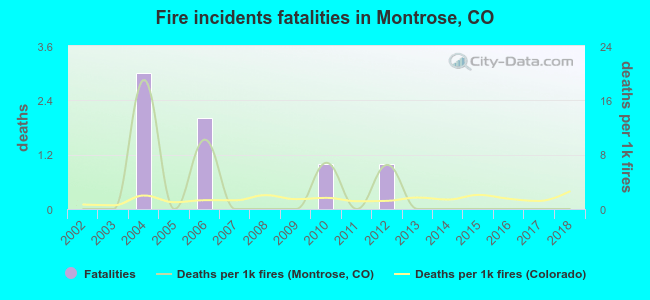 Based on the data from the years 2002 - 2018 the average number of fire-related yearly deaths is 0. The highest number of deaths - 3 took place in 2004, and the lowest - 0 in 2002. The data has a constant trend.
The average number of fatalities per 1,000 fires is 2. This indicator was the highest - 19 in 2004, and the lowest 0 in 2002. The trend for deaths per 1,000 fire incidents is constant. Compared to the Colorado value the number of deaths per 1,000 fires is higher.
Based on the data from the years 2002 - 2018 the average number of fire-related yearly deaths is 0. The highest number of deaths - 3 took place in 2004, and the lowest - 0 in 2002. The data has a constant trend.
The average number of fatalities per 1,000 fires is 2. This indicator was the highest - 19 in 2004, and the lowest 0 in 2002. The trend for deaths per 1,000 fire incidents is constant. Compared to the Colorado value the number of deaths per 1,000 fires is higher.Deaths per 1,000 incidents in Montrose, CO compared to nearest cities:
(Note: Based on data for all years, including only cities with at least 2,500 fire incidents)
| Montrose: | 2.7 |
| Grand Junction: | 2.2 |
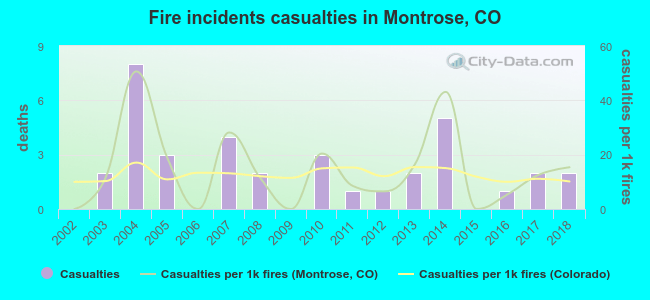 According to the reports from the years 2002 - 2018 the average number of fire-related casualties per year is 2. The highest number of reported injuries - 8 took place in 2004, and the lowest - 0 in 2002. The data has a rising trend.
The average number of injuries per 1,000 fires is 15. This indicator was the highest - 51 in 2004, and the lowest 0 in 2002. The trend for injuries per 1,000 incidents is increasing. Compared to the state value the number of casualties per 1,000 fires is about the same.
According to the reports from the years 2002 - 2018 the average number of fire-related casualties per year is 2. The highest number of reported injuries - 8 took place in 2004, and the lowest - 0 in 2002. The data has a rising trend.
The average number of injuries per 1,000 fires is 15. This indicator was the highest - 51 in 2004, and the lowest 0 in 2002. The trend for injuries per 1,000 incidents is increasing. Compared to the state value the number of casualties per 1,000 fires is about the same.Casualties per 1,000 incidents in Montrose, CO compared to nearest cities:
(Note: Based on data for all years, including only cities with at least 500 fire incidents)
| Montrose: | 13.9 |
| Hotchkiss: | 0.0 |
| Clifton: | 3.0 |
| Grand Junction: | 18.4 |
| Fruita: | 1.8 |
| Parachute: | 0.0 |
| Carbondale: | 1.2 |
| Rifle: | 0.0 |
| Glenwood Springs: | 6.0 |
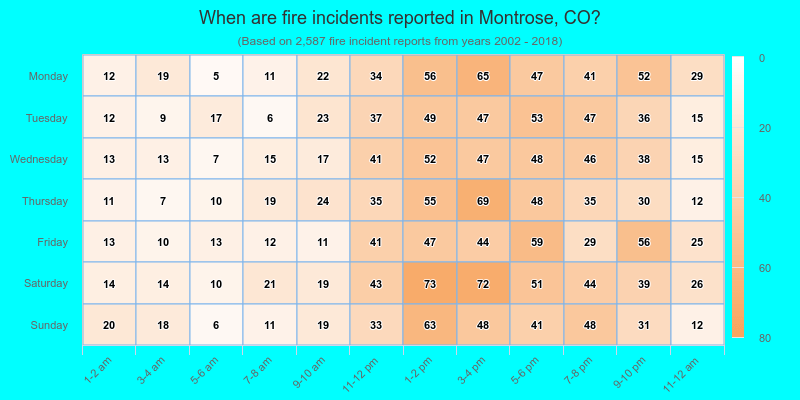
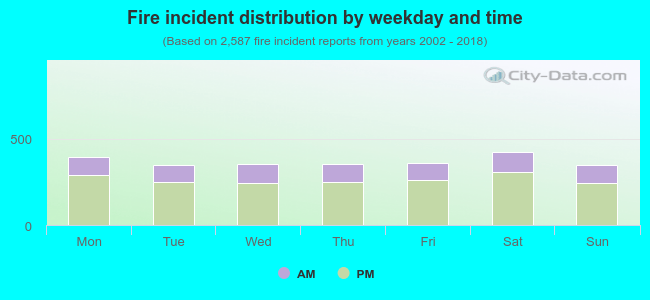 28.9% incidents where reported in the morning and 71.1% in the evening. The most fires (16.5%) took place on Saturday, and the least (13.5%) on Sunday.
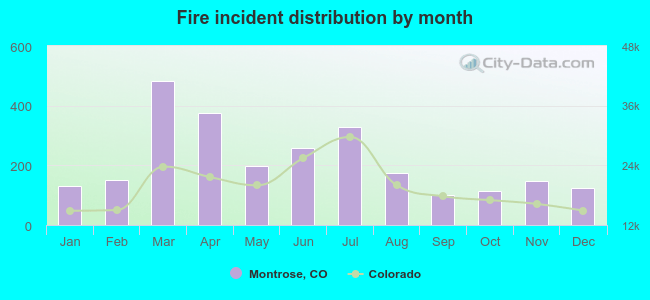 Based on the 2,587 fire incident reports from years 2002 - 2018 most fires (18.7%) took place during March, and the least (3.9%) in September.
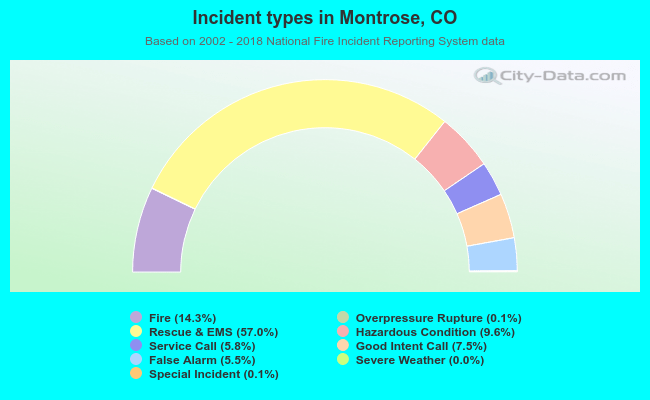 Out of all 18,054 cases reported during the years 2002 - 2018, the most belonged to the categories: Rescue & EMS (57.0%), Fire (14.3%), and Hazardous Condition (9.6%).
 When looking into fire subcategories, the most reports belonged to: Outside Fires (57.0%), and Structure Fires (30.8%).