Montevideo: Fire Incidents, Minnesota (MN)
Where are fire incidents reported in Montevideo, MN
Something went wrong! Please refresh the page.
|
| |||||||||||||||||||||||||||||||||||||||||||||||||||||||||||||||||||||||||||||||||||||||||||||||||||||||||||||
| Other | 9 | |||||||||||||||||||||||||||||||||||||||||||||||||||||||||||||||||||||||||||||||||||||||||||||||||||||||||||||
2002 - 2018 National Fire Incident Reporting System (NFIRS) incidents
- Incident types reported to NFIRS in Montevideo, MN
- 33356.9%Fire
- 10417.8%Hazardous Condition
- 7012.0%False Alarm
- 345.8%Good Intent Call
- 284.8%Rescue & EMS
- 91.5%Service Call
- 61.0%Severe Weather
- 10.2%Special Incident
- Fire incident types reported to NFIRS in Montevideo, MN
- 12336.9%Structure Fires
- 12136.3%Outside Fires
- 6820.4%Mobile Property/Vehicle Fires
- 216.3%Other
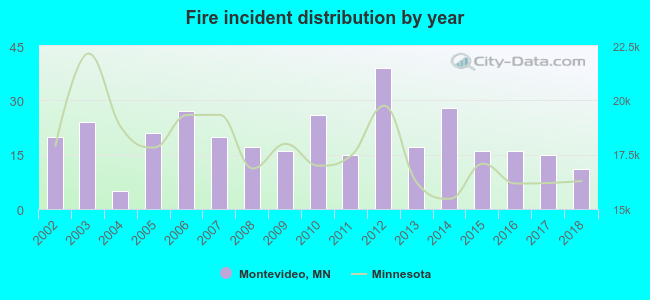 Based on the data from the years 2002 - 2018 the average number of fire incidents per year is 20. The highest number of fire incidents - 39 took place in 2012, and the least - 5 in 2004. The data has a declining trend.
The average number of yearly fire incidents per 10k residents in Montevideo, MN compared to nearest cities:
(Note: Based on data for the last 3 years, including only cities with population 5,000 and above)
| Montevideo: | 26.8 |
| Marshall: | 28.1 |
| Willmar: | 32.5 |
| Redwood Falls: | 31.0 |
| Morris: | 11.2 |

 30.9% incidents where reported in the morning and 69.1% in the evening. The most fires (15.3%) took place on Monday, and the least (12.9%) on Friday.
 According to the 333 fires from years 2002 - 2018 most fires (13.8%) took place during April, and the least (5.4%) in March.
 Out of all 585 cases reported during the years 2002 - 2018, the most belonged to the categories: Fire (56.9%), Rescue & EMS (17.8%), and Good Intent Call (12.0%).
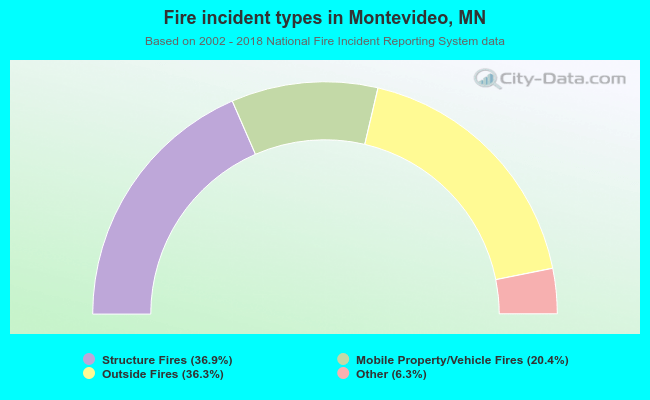 When looking into fire subcategories, the most reports belonged to: Structure Fires (36.9%), and Outside Fires (36.3%).