Montevallo: Fire Incidents, Alabama (AL)
Where are fire incidents reported in Montevallo, AL
Something went wrong! Please refresh the page.
|
| |||||||||||||||||||||||||||||||||||||||||||||||||||||||||||||||||||||||||||||||||||||||||||||||||||||||||||||
2005 - 2018 National Fire Incident Reporting System (NFIRS) incidents
- Incident types reported to NFIRS in Montevallo, AL
- 1,17961.8%Rescue & EMS
- 25013.1%Good Intent Call
- 19610.3%Service Call
- 1719.0%Fire
- 733.8%False Alarm
- 331.7%Hazardous Condition
- 40.2%Severe Weather
- 20.1%Special Incident
- Fire incident types reported to NFIRS in Montevallo, AL
- 7644.4%Structure Fires
- 7040.9%Outside Fires
- 169.4%Mobile Property/Vehicle Fires
- 95.3%Other
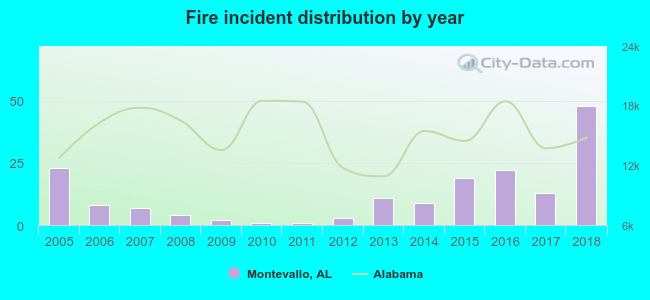 According to the data from the years 2005 - 2018 the average number of fires per year is 12. The highest number of reported fire incidents - 48 took place in 2018, and the least - 1 in 2010. The data has a rising trend.
The average number of yearly fire incidents per 10k residents in Montevallo, AL compared to nearest cities:
(Note: Based on data for the last 3 years, including only cities with population 5,000 and above)
| Montevallo: | 41.9 |
| Calera: | 45.0 |
| Alabaster: | 26.4 |
| Helena: | 3.4 |
| Pelham: | 33.9 |
| Hoover: | 8.0 |
| Chelsea: | 40.3 |
| Abernant: | 1.3 |
| Bessemer: | 92.8 |
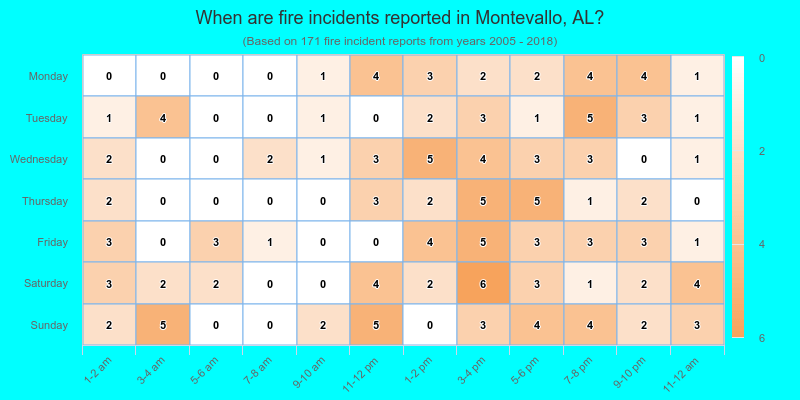
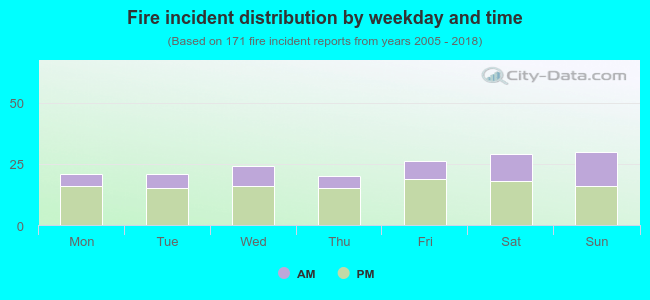 32.7% incidents where reported in the morning and 67.3% in the evening. The most fires (17.5%) took place on Sunday, and the least (11.7%) on Thursday.
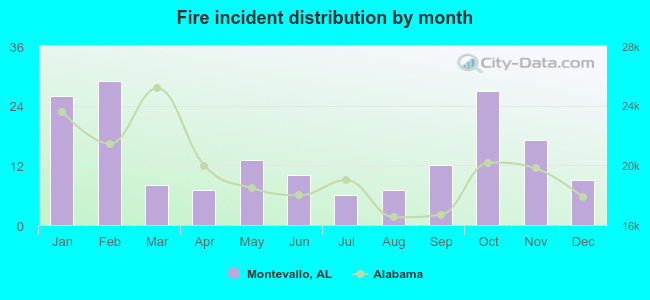 Based on the 171 fires from years 2005 - 2018 most fires (17.0%) took place during February, and the least (3.5%) in July.
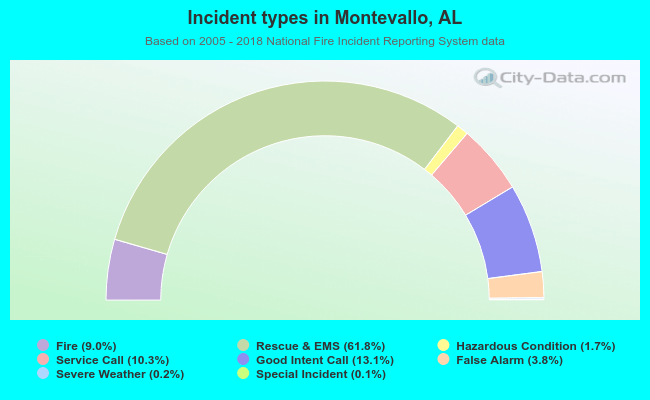 Out of all 1,908 cases reported during the years 2005 - 2018, the most belonged to the categories: Overpressure Rupture (61.8%), Service Call (13.1%), and Hazardous Condition (10.3%).
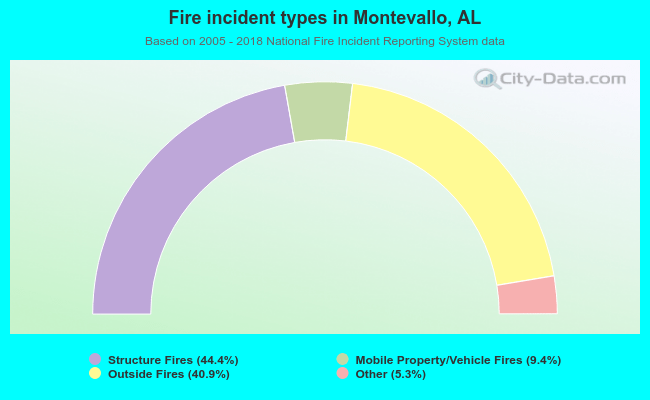 When looking into fire subcategories, the most incidents belonged to: Structure Fires (44.4%), and Outside Fires (40.9%).