| Fire incidents reported |
|---|
| Sreet name | Count |
|---|
| STRAWBERRY LOOKOUT | 14 | | HIGHWAY 518 | 12 | | HOLMES GULCH | 10 | | I15 | 10 | | MCCLELLAN CREEK | 8 | | MCCLELLAN CREEK RD | 8 | | JACKSON CREEK RD | 6 | | MARTINEZ GULCH | 6 | | MCCLELLAN CRK | 6 | | SOUTH HILLS RD | 6 | | 518 HWY | 4 | | BRIDLE BIT LOOP | 4 | | HOWARD BEER RD | 4 | | I-15 | 4 | | I-15 HWY | 4 | | MERGENTHALER | 4 | | MERGENTHALER RD | 4 | | MICROWAVE HILL | 4 | | MICROWAVE HILL RD | 4 | | MICROWAVE RD | 4 | | PARADISE LANE | 4 | | RIDGEVIEW | 4 | | SHADOW RIDGE | 4 | | SIDEWINDER LOOP | 4 | | SOUTH HILLS RD | 4 |
| | | Fire incidents reported |
|---|
| Sreet name | Count |
|---|
| WILDLISH LN | 4 | | 1 JACKSON CREEK RD | 2 | | 10 TWO MULE TRAIL | 2 | | 100 HIGHWAY 518 | 2 | | 151 MICROWAVE HILL | 2 | | 168 SOUTH HILLS DRIVE | 2 | | 17 HILLS BROTHERS ROAD | 2 | | 20 RIDGE VIEW | 2 | | 221 MCCLELLAND CREEK ROAD | 2 | | 25 BRIDLE BIT LOOP | 2 | | 282 HWY | 2 | | 2ND ST | 2 | | 338 MCCOLLEN CREEK ROAD RD | 2 | | 38 INDUSTRIAL LOOP | 2 | | 4 MISSION MOUNTAIN ROAD | 2 | | 4 RIDGEVIEW COURT | 2 | | 4 VALLEY VIEW DRIVE | 2 | | 40 HOMESTEAD ESTATES | 2 | | 518 HIGHWAY HWY | 2 | | 587 HWY | 2 | | 603 MCCLELLAND CREEK ROAD | 2 | | 7 SHADOW RIDGE | 2 | | 9 WILLIAMS WAY | 2 | | 99 MICROWAVE HILL ROAD | 2 | | |
|
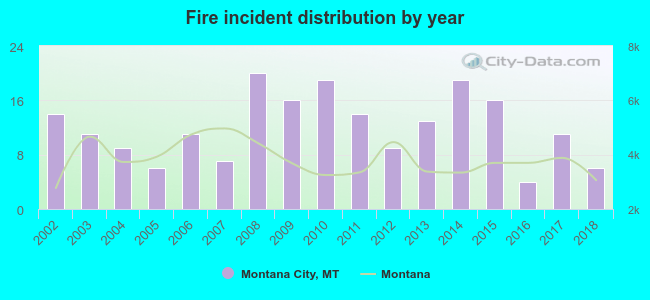 Based on the data from the years 2002 - 2018 the average number of fire incidents per year is 12. The highest number of reported fires - 20 took place in 2008, and the least - 4 in 2016. The data has a dropping trend.
 27.3% incidents where reported in the morning and 72.7% in the evening. The most fires (22.4%) took place on Monday, and the least (11.2%) on Tuesday.
 According to the 205 fire incidents from years 2002 - 2018 most fires (21.0%) took place during August, and the least (2.9%) in November.
 Out of all 564 cases reported during the years 2002 - 2018, the most belonged to the categories: Fire (36.3%), Good Intent Call (23.9%), and Rescue & EMS (19.0%).
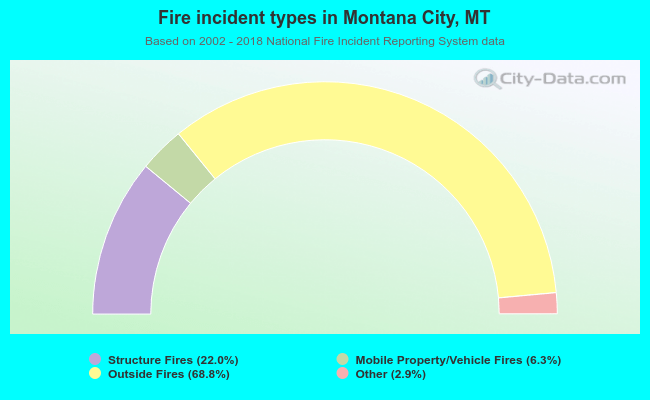 When looking into fire subcategories, the most reports belonged to: Outside Fires (68.8%), and Structure Fires (22.0%).