Monrovia: Fire Incidents, Indiana (IN)
Where are fire incidents reported in Monrovia, IN
Something went wrong! Please refresh the page.
|
| |||||||||||||||||||||||||||||||||||||||||||||||||||||||||||||||||||||||||||||||||||||||||||||||||||||||||||||
| Other | 38 | |||||||||||||||||||||||||||||||||||||||||||||||||||||||||||||||||||||||||||||||||||||||||||||||||||||||||||||
2002 - 2017 National Fire Incident Reporting System (NFIRS) incidents
- Incident types reported to NFIRS in Monrovia, IN
- 53641.6%Rescue & EMS
- 48037.3%Fire
- 13510.5%Good Intent Call
- 886.8%Hazardous Condition
- 211.6%False Alarm
- 191.5%Service Call
- 50.4%Special Incident
- 40.3%Severe Weather
- Fire incident types reported to NFIRS in Monrovia, IN
- 21244.2%Structure Fires
- 16835.0%Outside Fires
- 6714.0%Mobile Property/Vehicle Fires
- 336.9%Other
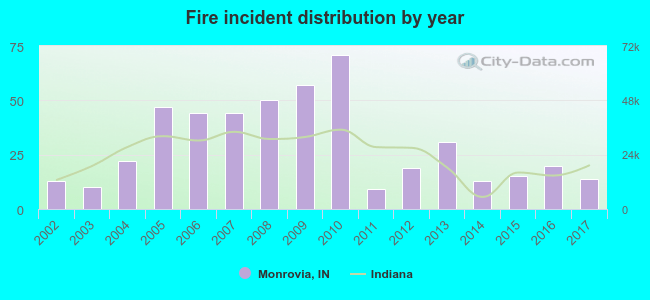 According to the data from the years 2002 - 2017 the average number of fires per year is 30. The highest number of fire incidents - 71 took place in 2010, and the least - 9 in 2011. The data has a rising trend.
 30.2% incidents where reported in the morning and 69.8% in the evening. The most fires (16.5%) took place on Sunday, and the least (9.2%) on Thursday.
 According to the 480 fire incidents from years 2002 - 2017 most fires (14.2%) took place during April, and the least (4.6%) in August.
 Out of all 1,288 cases reported during the years 2002 - 2017, the most belonged to the categories: Overpressure Rupture (41.6%), Fire (37.3%), and Service Call (10.5%).
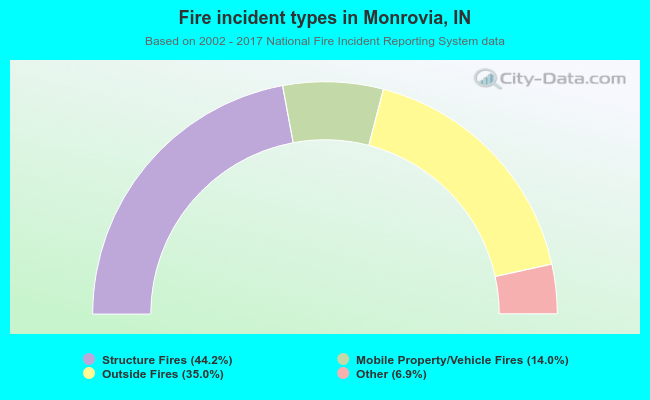 When looking into fire subcategories, the most reports belonged to: Structure Fires (44.2%), and Outside Fires (35.0%).