Monee: Fire Incidents, Illinois (IL)
Where are fire incidents reported in Monee, IL
Something went wrong! Please refresh the page.
| Fire incidents reported | |
|---|---|
| Sreet name | Count |
| PAULING RD | 92 |
| MANHATTAN MONEE RD | 72 |
| BRUNS RD | 64 |
| EGYPTIAN TRL | 58 |
| GOVERNORS HWY | 52 |
| OFFNER RD | 52 |
| HARLEM AVE | 46 |
| MONEEMANHATTAN RD | 44 |
| RIDGELAND AVE | 36 |
| MAIN ST | 32 |
| KEDZIE AVE | 28 |
| DRALLE RD | 26 |
| LILAC AVE | 24 |
| STEGER RD | 24 |
| 80TH AVE | 22 |
| CENTRAL AVE | 22 |
| HIGHLAND AVE | 22 |
| MARGARET ST | 22 |
| OAK RD | 20 |
| BUSH CT | 18 |
| KUERSTEN RD | 18 |
| CLEVELAND AVE | 16 |
| CRETE MONEE RD | 16 |
| LINDEN AVE | 16 |
| OFFNER | 16 |
| WILL CENTER RD | 16 |
| 88TH AVE | 14 |
| CARDINAL CT | 14 |
| PAULING | 14 |
| STUNKEL RD | 14 |
| Other | 91 |
2003 - 2018 National Fire Incident Reporting System (NFIRS) incidents
- Incident types reported to NFIRS in Monee, IL
- 3,36445.8%Rescue & EMS
- 1,02113.9%Fire
- 94712.9%False Alarm
- 92212.5%Service Call
- 5577.6%Good Intent Call
- 5056.9%Hazardous Condition
- 220.3%Special Incident
- 80.1%Overpressure Rupture
- Fire incident types reported to NFIRS in Monee, IL
- 53152.0%Structure Fires
- 29328.7%Outside Fires
- 14514.2%Mobile Property/Vehicle Fires
- 525.1%Other
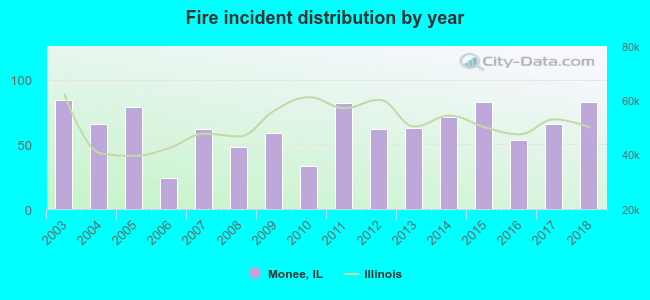 Based on the data from the years 2003 - 2018 the average number of fires per year is 64. The highest number of reported fires - 84 took place in 2003, and the least - 24 in 2006. The data has a dropping trend.
The average number of yearly fire incidents per 10k residents in Monee, IL compared to nearest cities:
(Note: Based on data for the last 3 years, including only cities with population 5,000 and above)
| Monee: | 131.9 |
| University Park: | 72.8 |
| Richton Park: | 46.3 |
| Park Forest: | 45.2 |
| Matteson: | 55.2 |
| Steger: | 37.3 |
| Crete: | 116.7 |
| Olympia Fields: | 19.8 |
| Frankfort: | 46.4 |
 The median response time based on all reported fire incidents is 6 minutes. This is similar to the state median value.
The median response time in Monee, IL compared to nearest cities:
(Note: Based on data for all years, including only cities with at least 500 fire incidents)
| Monee: | 6 minutes |
| University Park: | 6 minutes |
| Richton Park: | 6 minutes |
| Park Forest: | 5 minutes |
| Matteson: | 6 minutes |
| Peotone: | 8 minutes |
| Steger: | 5 minutes |
| Crete: | 6 minutes |
| Frankfort: | 6 minutes |
 According to the reports from the years 2003 - 2018 the average number of fire-related yearly casualties is 0. The highest number of injuries - 2 took place in 2018, and the lowest - 0 in 2003. The data has an increasing trend.
The average number of injuries per 1,000 fires is 4. This indicator was the highest - 24 in 2018, and the lowest 0 in 2003. The trend for casualties per 1,000 fires is increasing. Compared to the state value the number of casualties per 1,000 fire incidents is much lower.
According to the reports from the years 2003 - 2018 the average number of fire-related yearly casualties is 0. The highest number of injuries - 2 took place in 2018, and the lowest - 0 in 2003. The data has an increasing trend.
The average number of injuries per 1,000 fires is 4. This indicator was the highest - 24 in 2018, and the lowest 0 in 2003. The trend for casualties per 1,000 fires is increasing. Compared to the state value the number of casualties per 1,000 fire incidents is much lower.Casualties per 1,000 incidents in Monee, IL compared to nearest cities:
(Note: Based on data for all years, including only cities with at least 500 fire incidents)
| Monee: | 3.9 |
| University Park: | 8.1 |
| Richton Park: | 6.1 |
| Park Forest: | 37.5 |
| Matteson: | 21.6 |
| Peotone: | 12.6 |
| Steger: | 6.8 |
| Crete: | 4.3 |
| Frankfort: | 6.0 |
 35.6% incidents where reported in the morning and 64.4% in the evening. The most fires (17.0%) took place on Saturday, and the least (12.3%) on Monday.
 Based on the 1,021 reports from years 2003 - 2018 most fires (11.6%) took place during April, and the least (5.3%) in January.
 Out of all 7,350 cases reported during the years 2003 - 2018, the most belonged to the categories: Rescue & EMS (45.8%), Fire (13.9%), and False Alarm (12.9%).
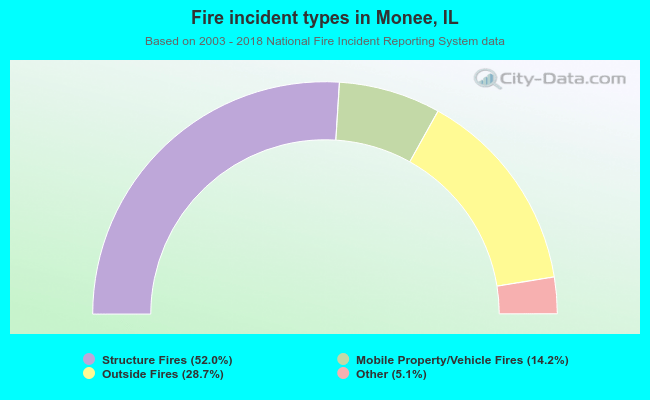 When looking into fire subcategories, the most incidents belonged to: Structure Fires (52.0%), and Outside Fires (28.7%).