Mondovi: Fire Incidents, Wisconsin (WI)
Where are fire incidents reported in Mondovi, WI
Something went wrong! Please refresh the page.
|
| |||||||||||||||||||||||||||||||||||||||||||||||||||||||||||||||||||||||||||||||||||||||||||||||||||||||||||||
| Other | 84 | |||||||||||||||||||||||||||||||||||||||||||||||||||||||||||||||||||||||||||||||||||||||||||||||||||||||||||||
2002 - 2018 National Fire Incident Reporting System (NFIRS) incidents
- Incident types reported to NFIRS in Mondovi, WI
- 48847.8%Fire
- 29729.1%Rescue & EMS
- 11010.8%Hazardous Condition
- 565.5%Good Intent Call
- 242.4%Service Call
- 242.4%False Alarm
- 121.2%Special Incident
- 70.7%Severe Weather
- 20.2%Overpressure Rupture
- Fire incident types reported to NFIRS in Mondovi, WI
- 20942.8%Structure Fires
- 20441.8%Outside Fires
- 6613.5%Mobile Property/Vehicle Fires
- 91.8%Other
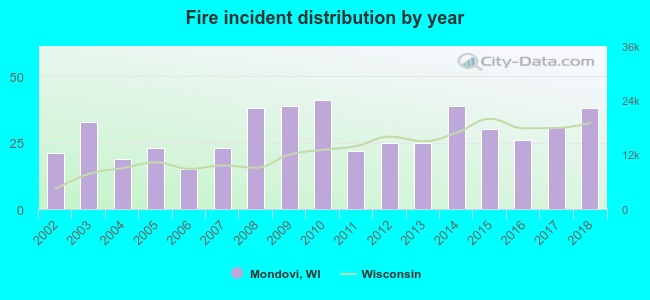 According to the data from the years 2002 - 2018 the average number of fire incidents per year is 29. The highest number of fire incidents - 41 took place in 2010, and the least - 15 in 2006. The data has a growing trend.
 According to the data from the years 2002 - 2018 the average number of fire-related yearly casualties is 0. The highest number of reported injuries - 2 took place in 2013, and the lowest - 0 in 2004. The data has a dropping trend.
 29.9% incidents where reported in the morning and 70.1% in the evening. The most fires (16.2%) took place on Saturday, and the least (11.1%) on Thursday.
 According to the 488 reports from years 2002 - 2018 most fires (20.7%) took place during April, and the least (3.7%) in August.
 Out of all 1,020 cases reported during the years 2002 - 2018, the most belonged to the categories: Fire (47.8%), Rescue & EMS (29.1%), and Hazardous Condition (10.8%).
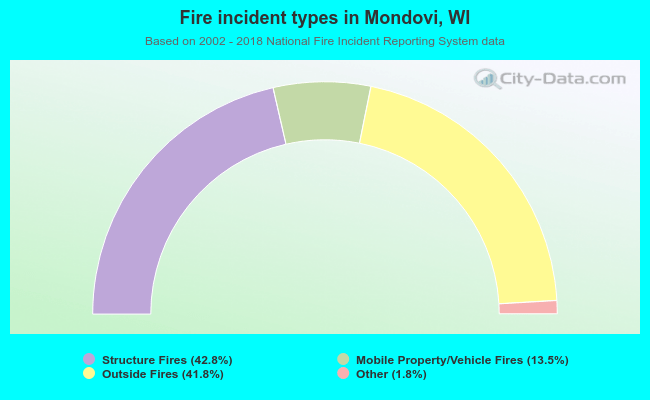 When looking into fire subcategories, the most reports belonged to: Structure Fires (42.8%), and Outside Fires (41.8%).