Moncks Corner: Fire Incidents, South Carolina (SC)
Where are fire incidents reported in Moncks Corner, SC
Something went wrong! Please refresh the page.
| Fire incidents reported | |
|---|---|
| Sreet name | Count |
| 52 HWY | 254 |
| LIVE OAK DR | 234 |
| CYPRESS GARDENS RD | 118 |
| GAILLARD RD | 98 |
| OLD WHITESVILLE RD | 98 |
| BLACK TOM RD | 96 |
| SOUTH LIVE OAK DRIVE | 92 |
| MAIN ST | 90 |
| OLD 52 HWY | 86 |
| FARRELL ST | 78 |
| HIGHWAY 52 | 78 |
| COOPER STORE RD | 74 |
| 6 HWY | 66 |
| STATE RD | 60 |
| OAKLEY RD | 56 |
| WINDING RD | 56 |
| BRADLEY RD | 52 |
| WHITESVILLE RD | 52 |
| 17A HWY | 44 |
| BIRCHWOOD DR | 40 |
| BONNOITT ST | 40 |
| GANTS RD | 40 |
| LEVEE DR | 38 |
| PINOPOLIS RD | 38 |
| BEN BARRON LN | 36 |
| COMPTON DR | 36 |
| GULLEDGE ST | 36 |
| WEST END DR | 36 |
| CORAL ACRES DR | 34 |
| GROSS AVE | 34 |
| Other | 1,739 |
2002 - 2018 National Fire Incident Reporting System (NFIRS) incidents
- Incident types reported to NFIRS in Moncks Corner, SC
- 9,96551.8%Rescue & EMS
- 3,92920.4%Fire
- 1,7289.0%Hazardous Condition
- 1,5838.2%Good Intent Call
- 1,1375.9%False Alarm
- 6563.4%Service Call
- 1050.5%Overpressure Rupture
- 960.5%Severe Weather
- 560.3%Special Incident
- Fire incident types reported to NFIRS in Moncks Corner, SC
- 1,73544.2%Structure Fires
- 1,60840.9%Outside Fires
- 50812.9%Mobile Property/Vehicle Fires
- 782.0%Other
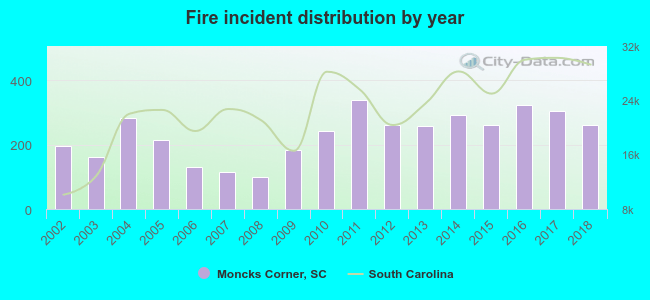 Based on the data from the years 2002 - 2018 the average number of fires per year is 231. The highest number of fire incidents - 338 took place in 2011, and the least - 99 in 2008. The data has a growing trend.
The average number of yearly fire incidents per 10k residents in Moncks Corner, SC compared to nearest cities:
(Note: Based on data for the last 3 years, including only cities with population 5,000 and above)
| Moncks Corner: | 313.6 |
| Cross: | 83.7 |
| Goose Creek: | 39.1 |
| Ladson: | 102.5 |
| Summerville: | 100.5 |
| Wando: | 18.9 |
| Hanahan: | 29.4 |
| North Charleston: | 73.9 |
| Mount Pleasant: | 2.8 |
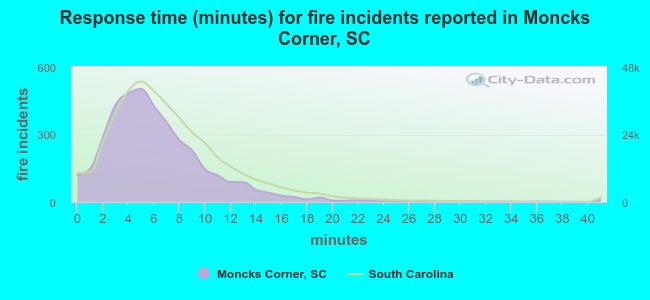 The median response time based on all reported fire incidents is 5 minutes. This is lower compared to the South Carolina median value.
The median response time in Moncks Corner, SC compared to nearest cities:
(Note: Based on data for all years, including only cities with at least 500 fire incidents)
| Moncks Corner: | 5 minutes |
| Cross: | 12 minutes |
| Goose Creek: | 5 minutes |
| Ladson: | 5 minutes |
| Summerville: | 6 minutes |
| Ridgeville: | 9 minutes |
| North Charleston: | 5 minutes |
| Eutawville: | 10 minutes |
| Holly Hill: | 13 minutes |
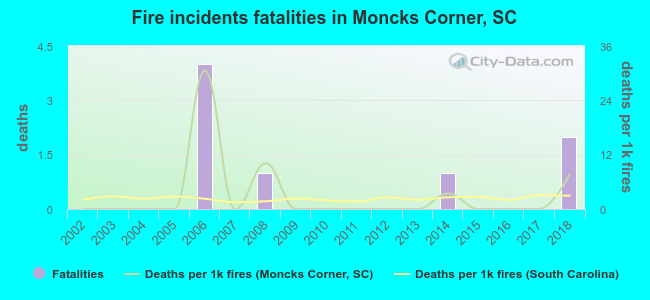 Based on the reports from the years 2002 - 2018 the average number of fire-related yearly deaths is 0. The highest number of deaths - 4 took place in 2006, and the lowest - 0 in 2002. The data has an increasing trend.
The average number of deaths per 1,000 fire incidents is 3. This indicator was the highest - 31 in 2006, and the lowest 0 in 2002. The trend for deaths per 1,000 fires is growing. Compared to the state value the number of deaths per 1,000 fire incidents is similar.
Based on the reports from the years 2002 - 2018 the average number of fire-related yearly deaths is 0. The highest number of deaths - 4 took place in 2006, and the lowest - 0 in 2002. The data has an increasing trend.
The average number of deaths per 1,000 fire incidents is 3. This indicator was the highest - 31 in 2006, and the lowest 0 in 2002. The trend for deaths per 1,000 fires is growing. Compared to the state value the number of deaths per 1,000 fire incidents is similar.Deaths per 1,000 incidents in Moncks Corner, SC compared to nearest cities:
(Note: Based on data for all years, including only cities with at least 2,500 fire incidents)
| Moncks Corner: | 2.0 |
| Summerville: | 1.1 |
| North Charleston: | 2.7 |
| Charleston: | 1.3 |
| Manning: | 0.0 |
| Walterboro: | 2.1 |
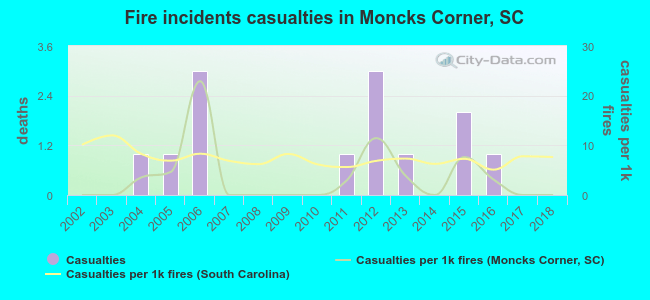 Based on the data from the years 2002 - 2018 the average number of fire-related casualties per year is 1. The highest number of casualties - 3 took place in 2006, and the lowest - 0 in 2002. The data has a constant trend.
The average number of casualties per 1,000 fire incidents is 4. This indicator was the highest - 23 in 2006, and the lowest 0 in 2002. The trend for casualties per 1,000 incidents is dropping. Compared to the state value the number of casualties per 1,000 fire incidents is much lower.
Based on the data from the years 2002 - 2018 the average number of fire-related casualties per year is 1. The highest number of casualties - 3 took place in 2006, and the lowest - 0 in 2002. The data has a constant trend.
The average number of casualties per 1,000 fire incidents is 4. This indicator was the highest - 23 in 2006, and the lowest 0 in 2002. The trend for casualties per 1,000 incidents is dropping. Compared to the state value the number of casualties per 1,000 fire incidents is much lower.Casualties per 1,000 incidents in Moncks Corner, SC compared to nearest cities:
(Note: Based on data for all years, including only cities with at least 500 fire incidents)
| Moncks Corner: | 3.3 |
| Cross: | 1.5 |
| Goose Creek: | 13.3 |
| Ladson: | 2.1 |
| Summerville: | 7.6 |
| Ridgeville: | 0.0 |
| North Charleston: | 25.2 |
| Eutawville: | 9.3 |
| Holly Hill: | 0.0 |
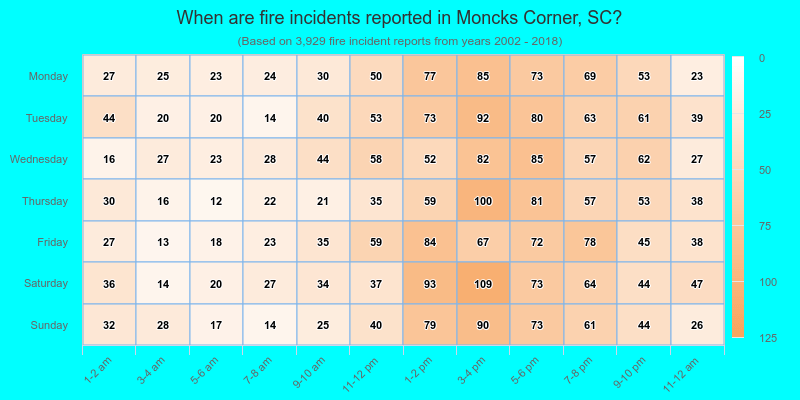
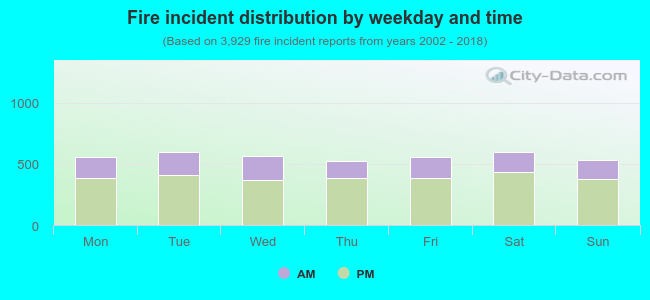 30.6% incidents where reported in the morning and 69.4% in the evening. The most fires (15.2%) took place on Tuesday, and the least (13.3%) on Thursday.
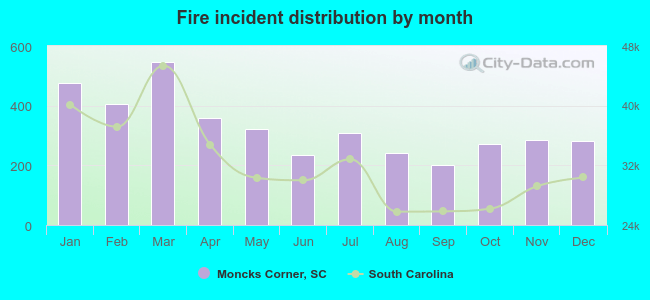 According to the 3,929 reports from years 2002 - 2018 most fires (13.9%) took place during March, and the least (5.1%) in September.
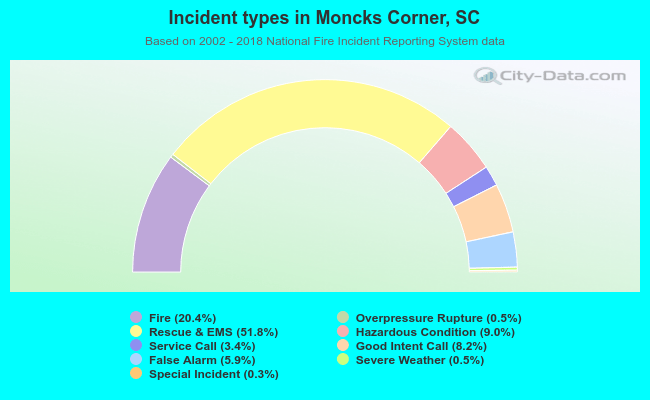 Out of all 19,255 cases reported during the years 2002 - 2018, the most belonged to the categories: Rescue & EMS (51.8%), Fire (20.4%), and Hazardous Condition (9.0%).
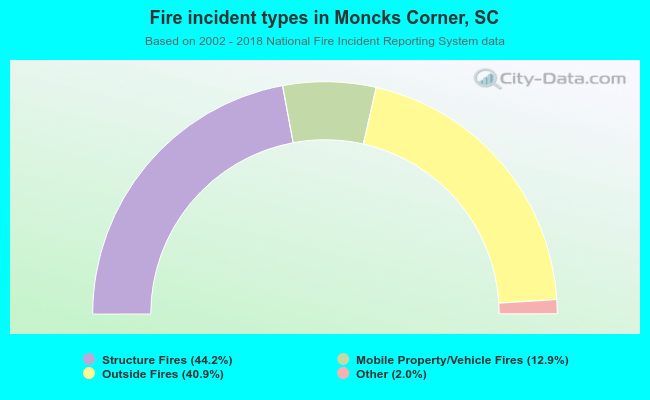 When looking into fire subcategories, the most incidents belonged to: Structure Fires (44.2%), and Outside Fires (40.9%).