| Fire incidents reported |
|---|
| Sreet name | Count |
|---|
| MOLINO RD | 54 | | HIGHWAY 29 | 44 | | BARRINEAU PARK RD | 28 | | HIGHWAY 95A | 24 | | HIGHWAY 97 | 24 | | FAIRGROUND RD | 20 | | BARTH RD | 18 | | CHESTNUT RD | 18 | | HIGHWAY 99 | 14 | | SUNSHINE HILL RD | 14 | | CRABTREE CHURCH RD | 12 | | PILGRIM TRL | 12 | | BRICKYARD RD | 10 | | GIBSON RD | 10 | | JACKS BRANCH RD | 10 | | RICHARDSON RD | 10 | | CEDARTOWN RD | 8 | | RUMFORD RD | 8 | | ANGUS LN | 6 | | BARRINEAU PARK BRIDGE | 6 | | DAFFIN RD | 6 | | HIGHWAY 196 | 6 | | JAHAZA ST | 6 | | SCHIFKO RD | 6 | | ANGUS CIR | 4 |
| | | Fire incidents reported |
|---|
| Sreet name | Count |
|---|
| AYER ST | 4 | | BARTH LN | 4 | | BET RAINES RD | 4 | | BLACKBERRY LN | 4 | | BLANC LN | 4 | | BRICKTON RD | 4 | | CENTURY BLVD | 4 | | CHALKER RD | 4 | | COTTON LAKE RD | 4 | | DEWEY ROSE LN | 4 | | NANCY LN | 4 | | NICHOLSON DR | 4 | | OMEGA DR | 4 | | RIVER BEND RD | 4 | | SCHAAG RD | 4 | | STRAUGHN RD | 4 | | WARHOP LN | 4 | | WEEPING WILLOW CT | 4 | | WHITE ASH RD | 4 | | ADA LN | 2 | | BARRINEAU LN | 2 | | BARRINEAU PARK SCHOOL RD | 2 | | BLUE BERRY LN | 2 | | BOOTH LAKE RD | 2 | | |
|
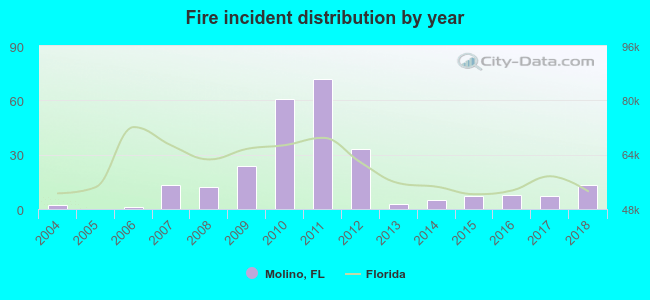 Based on the data from the years 2004 - 2018 the average number of fire incidents per year is 17. The highest number of reported fire incidents - 72 took place in 2011, and the least - 0 in 2005. The data has a growing trend.
 25.7% incidents where reported in the morning and 74.3% in the evening. The most fires (16.5%) took place on Saturday, and the least (10.7%) on Wednesday.
 According to the 261 fire incidents from years 2004 - 2018 most fires (16.1%) took place during January, and the least (2.3%) in September.
 Out of all 779 cases reported during the years 2004 - 2018, the most belonged to the categories: Rescue & EMS (40.3%), Fire (33.5%), and Service Call (8.5%).
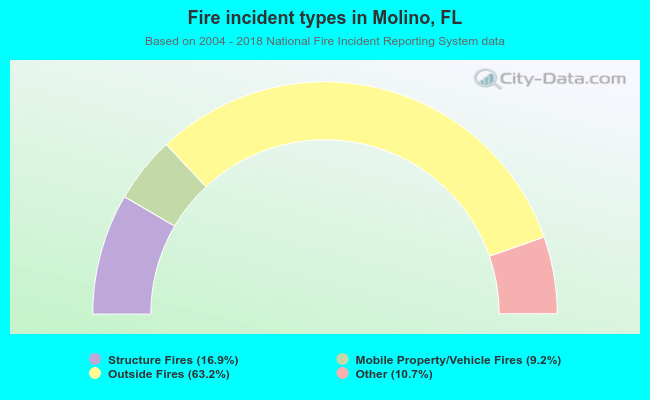 When looking into fire subcategories, the most reports belonged to: Outside Fires (63.2%), and Structure Fires (16.9%).