Moab: Fire Incidents, Utah (UT)
Where are fire incidents reported in Moab, UT
Something went wrong! Please refresh the page.
|
| |||||||||||||||||||||||||||||||||||||||||||||||||||||||||||||||||||||||||||||||||||||||||||||||||||||||||||||
2002 - 2018 National Fire Incident Reporting System (NFIRS) incidents
- Incident types reported to NFIRS in Moab, UT
- 12430.5%Fire
- 8320.4%Hazardous Condition
- 6716.5%Good Intent Call
- 4711.6%Rescue & EMS
- 4410.8%Service Call
- 317.6%False Alarm
- 71.7%Special Incident
- 30.7%Overpressure Rupture
- Fire incident types reported to NFIRS in Moab, UT
- 6149.2%Outside Fires
- 3729.8%Structure Fires
- 2318.5%Mobile Property/Vehicle Fires
- 32.4%Other
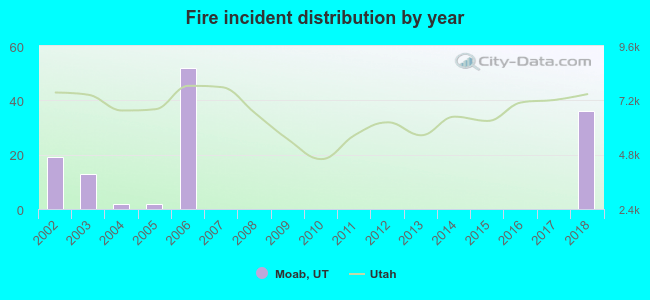 According to the data from the years 2002 - 2018 the average number of fires per year is 7. The highest number of reported fire incidents - 52 took place in 2006, and the least - 0 in 2007. The data has a rising trend.
The average number of yearly fire incidents per 10k residents in Moab, UT compared to nearest cities:
(Note: Based on data for the last 3 years, including only cities with population 5,000 and above)
| Moab: | 70.0 |
| Price: | 63.8 |
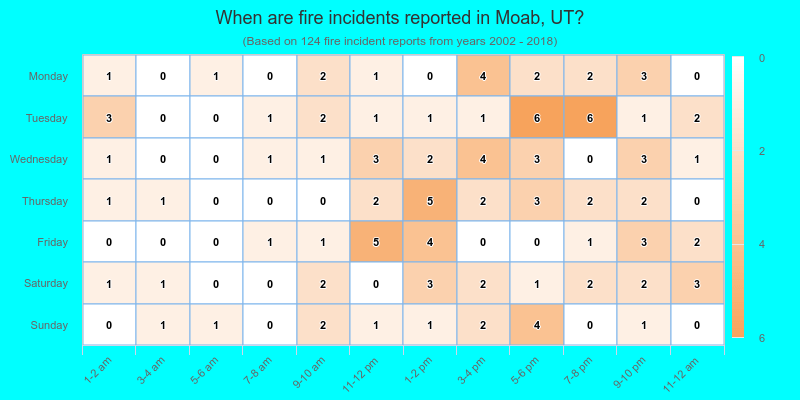
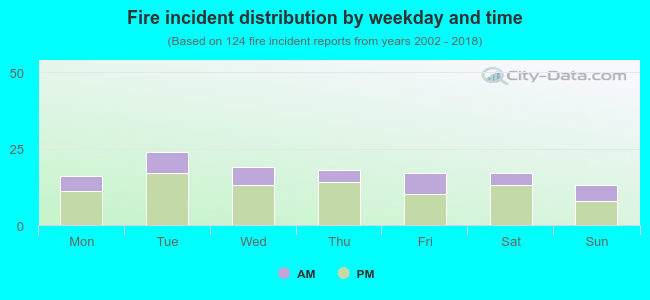 30.6% incidents where reported in the morning and 69.4% in the evening. The most fires (19.4%) took place on Tuesday, and the least (10.5%) on Sunday.
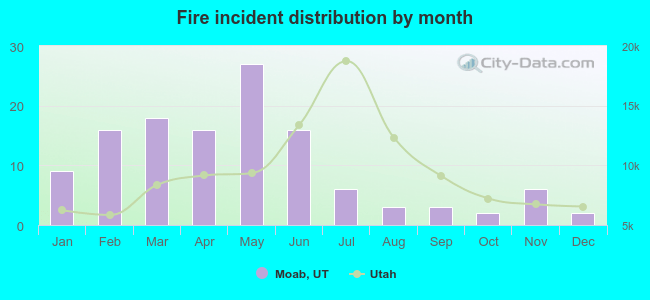 According to the 124 fires from years 2002 - 2018 most fires (21.8%) took place during May, and the least (1.6%) in October.
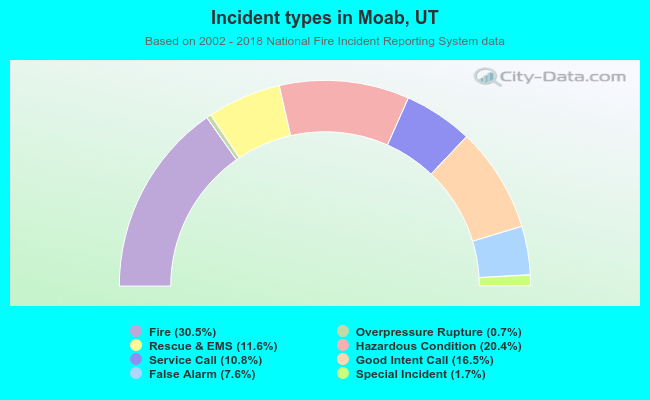 Out of all 406 cases reported during the years 2002 - 2018, the most belonged to the categories: Fire (30.5%), Hazardous Condition (20.4%), and Good Intent Call (16.5%).
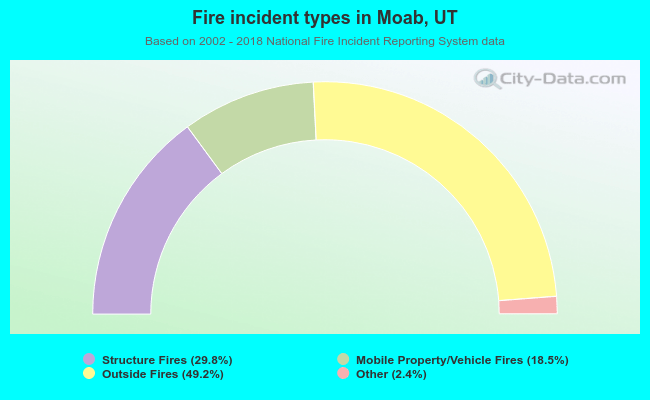 When looking into fire subcategories, the most reports belonged to: Outside Fires (49.2%), and Structure Fires (29.8%).