| Fire incidents reported |
|---|
| Sreet name | Count |
|---|
| KITTLE RD | 20 | | MILLER RD | 14 | | MT. TOM RD | 12 | | M-33 | 10 | | MORENCI AVE | 10 | | MT TOM RD | 10 | | M33 | 8 | | PERRY CREEK RD | 8 | | 210 AUSABLE WAY | 6 | | CURTISVILLE RD | 6 | | GALBRAITH RD | 6 | | MCKINLEY RD | 6 | | MILLER | 6 | | POPPS | 6 | | 114 S MT TOM RD | 4 | | 1365 CAUCHY RD | 4 | | 147 MT. TOM RD. | 4 | | 1761 ONWELLER DR | 4 | | 1871 KNEELAND RD | 4 | | 1926 CAMP TEN RD | 4 | | 222 W MILLER RD | 4 | | 237 POPPS RD. | 4 | | 290 BUNDOFF RD | 4 | | 3720 KIRTLAND CT. | 4 | | 432 N MT TOM RD | 4 |
| | | Fire incidents reported |
|---|
| Sreet name | Count |
|---|
| 4671 MCKINLEY RD | 4 | | 491 W KITTLE RD | 4 | | 4978 S MT TOM RD | 4 | | 629 CIRCLE DR. | 4 | | 64 POPPS RD | 4 | | 711 KNEELAND RD | 4 | | 862 HILLCREST | 4 | | FOX TRAIL | 4 | | GERBER RD | 4 | | HELMER LAKE RD | 4 | | HOY RD. | 4 | | KELLY ST | 4 | | M33 S OF TOWN | 4 | | OAK LAKE RD | 4 | | PEARL ST | 4 | | RANDALL RD | 4 | | WATSON & WAGNER LAKE RD | 4 | | 1008 8TH ST | 2 | | 104 HILDA LN | 2 | | 1062 RICHARDSON RD. | 2 | | 1065 PINE ST | 2 | | 1068 W KITTLE RD. | 2 | | 107 ARTHUR RANDALL DR | 2 | | 1073 W CHERY CREEK RD. | 2 | | |
|
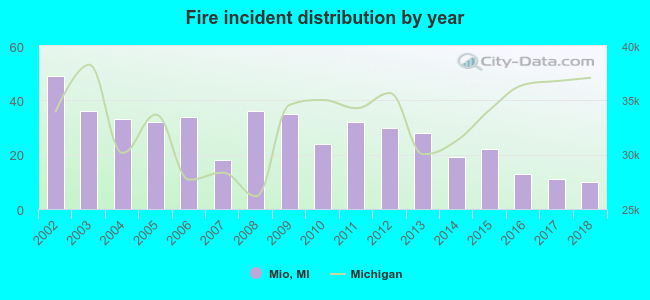 Based on the data from the years 2002 - 2018 the average number of fires per year is 27. The highest number of reported fire incidents - 49 took place in 2002, and the least - 10 in 2018. The data has a declining trend.
 29.2% incidents where reported in the morning and 70.8% in the evening. The most fires (19.5%) took place on Thursday, and the least (11.3%) on Tuesday.
 According to the 462 reports from years 2002 - 2018 most fires (18.0%) took place during April, and the least (4.3%) in September.
 Out of all 1,121 cases reported during the years 2002 - 2018, the most belonged to the categories: Hazardous Condition (45.7%), Fire (41.2%), and Rescue & EMS (6.3%).
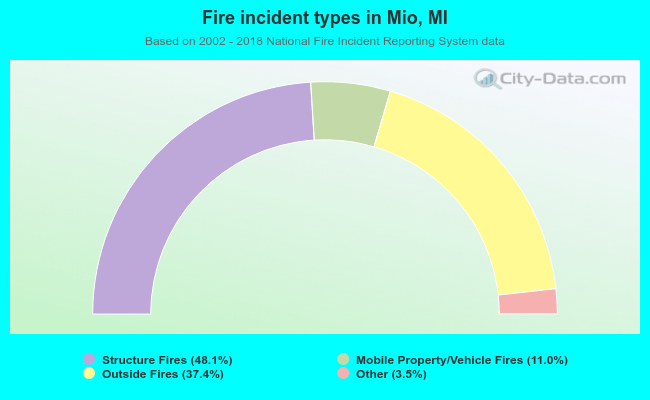 When looking into fire subcategories, the most reports belonged to: Structure Fires (48.1%), and Outside Fires (37.4%).