| Fire incidents reported |
|---|
| Sreet name | Count |
|---|
| INDUSTRIAL PARK | 10 | | CHESTNUT | 8 | | 405 SOUTH CHESTNUT ST | 6 | | 1311 CAROLYN DR | 4 | | 2100N 2200N | 4 | | 211 SHORT ST | 4 | | 27 NB I39 | 4 | | 3027 1800N | 4 | | 319 LOCUST ST | 4 | | 4TH ST | 4 | | 537 N WALNUT | 4 | | 902 MARY STREET | 4 | | CHESTNUT ST | 4 | | LOCUST | 4 | | LOCUST ST | 4 | | PATTONSBURG RD | 4 | | 1 MILE N5 MILES E | 2 | | 1025 MAPLE AVE | 2 | | 1031 LOCUST ST | 2 | | 116 251 | 2 | | 1311 N CAROLYN DRIVE | 2 | | 139 MILE 28 SB | 2 | | 1550 INDUSTRIAL PARK RDSMF | 2 | | 1600 NORTH | 2 | | 1600N 2800E | 2 |
| | | Fire incidents reported |
|---|
| Sreet name | Count |
|---|
| 1700 N 2700 E | 2 | | 1735 | 2 | | 1769 3100 E | 2 | | 1769 CO RD 3100 E | 2 | | 1769 COUNTY RD | 2 | | 1800N 116 | 2 | | 1800N 3000E | 2 | | 1814 RD 3100 E | 2 | | 1902 2900 E | 2 | | 1ST ST. | 2 | | 2 MILES WEST OF I39 | 2 | | 2-51 RT | 2 | | 2000N 2100N | 2 | | 2000N 3180E | 2 | | 2005 2500E | 2 | | 203 SHORT STREET | 2 | | 2100 N 2330 EAST | 2 | | 2100 N 3100 E | 2 | | 2100 N 3100 ZR | 2 | | 2100N 2500E | 2 | | 2100N 251 | 2 | | 2100N 2800E | 2 | | 2100N 3100E | 2 | | 214 W 8TH | 2 | | |
|
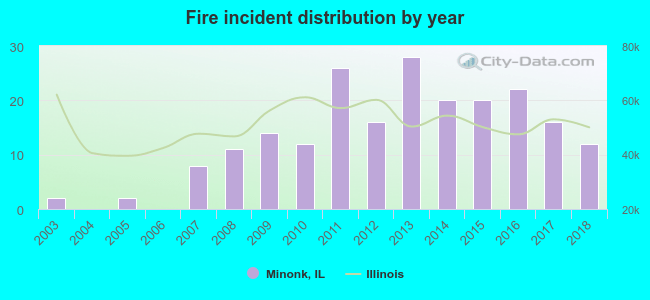 Based on the data from the years 2003 - 2018 the average number of fires per year is 13. The highest number of fires - 28 took place in 2013, and the least - 0 in 2004. The data has a rising trend.
 34.0% incidents where reported in the morning and 66.0% in the evening. The most fires (18.2%) took place on Monday, and the least (10.0%) on Friday.
 Based on the 209 fire incident reports from years 2003 - 2018 most fires (14.4%) took place during October, and the least (5.3%) in July.
 Out of all 493 cases reported during the years 2003 - 2018, the most belonged to the categories: Fire (42.4%), Overpressure Rupture (23.5%), and Rescue & EMS (17.0%).
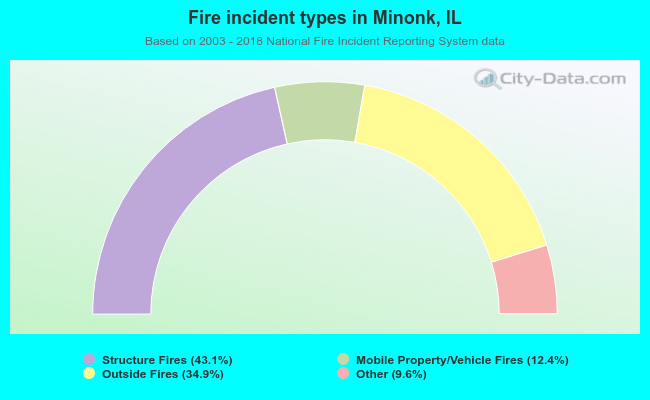 When looking into fire subcategories, the most incidents belonged to: Structure Fires (43.1%), and Outside Fires (34.9%).