| Fire incidents reported |
|---|
| Sreet name | Count |
|---|
| HWY 51 | 12 | | AGAWAK RD | 10 | | BLUE LAKE RD | 8 | | BLUE LAKE ROAD | 8 | | HIGHWAY 51 HWY | 8 | | PARK AVE | 8 | | SQUAW LAKE RD | 8 | | BACK BAY RD | 6 | | RICHARDSON PLAT RD | 6 | | BAKER LAKE RD | 4 | | BLUE LAKE ISLAND RD | 4 | | BOLGER LAKE RD | 4 | | CEDAR ST | 4 | | CLEARWATER RD | 4 | | HWY 70 WEST | 4 | | HWY. 70 WEST | 4 | | LAKEVIEW LANE | 4 | | LAMBERT RD | 4 | | MILWAUKEE ST | 4 | | OLD HWY 70 | 4 | | RANCHWOOD ROAD | 4 | | RICHARDSON PLAT RD. | 4 | | 1000 BROWTINE LA | 2 | | 10048 LAKEVIEW LANE | 2 | | 11103 KILWAEE ROAD | 2 |
| | | Fire incidents reported |
|---|
| Sreet name | Count |
|---|
| 1120 KILLAWEE RD | 2 | | 1542 RICHARDSON PLAT RD | 2 | | 521 ONEIDA STREET | 2 | | 70 WEST HWY | 2 | | 7516 TRAILWOOD | 2 | | 7849 LEARY ROAD | 2 | | 8240 HWY 51 | 2 | | 8409 W SQUAW LK RD | 2 | | 8511 WEST SQUAW LAKE ROAD | 2 | | 8519 SUTTON ROAD | 2 | | 8521 HOWER ROAD UNIT 26 | 2 | | 8631 PEGGY LN | 2 | | 8662 HWY. 51 | 2 | | 8720 BUCKSKIN TRAIL | 2 | | 8741 PACKING PLANT ROAD | 2 | | 8743 BRUNSWICK ROAD | 2 | | 8822 E MINCH DR. | 2 | | 9671 FAIRCHILD LANE | 2 | | 9960 BAKER LAKE ROAD | 2 | | BACK BAY | 2 | | BELLWOOD DR | 2 | | BIRCH | 2 | | BIRK DRIVE | 2 | | BIRK RD | 2 | | |
|
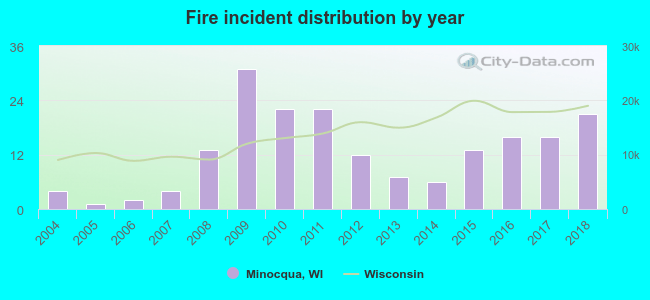 According to the data from the years 2004 - 2018 the average number of fire incidents per year is 13. The highest number of fire incidents - 31 took place in 2009, and the least - 1 in 2005. The data has a growing trend.
 32.6% incidents where reported in the morning and 67.4% in the evening. The most fires (22.1%) took place on Sunday, and the least (10.5%) on Monday.
 According to the 190 fires from years 2004 - 2018 most fires (12.1%) took place during June, and the least (3.7%) in August.
 Out of all 532 cases reported during the years 2004 - 2018, the most belonged to the categories: Fire (35.7%), Rescue & EMS (18.4%), and Hazardous Condition (16.9%).
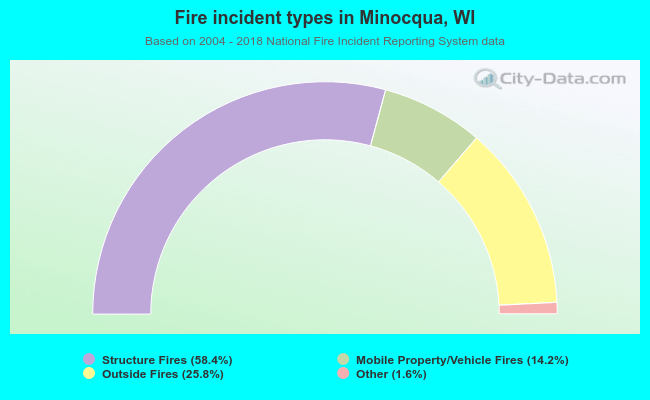 When looking into fire subcategories, the most reports belonged to: Structure Fires (58.4%), and Outside Fires (25.8%).