Mineola: Fire Incidents, New York (NY)
Where are fire incidents reported in Mineola, NY
Something went wrong! Please refresh the page.
|
| |||||||||||||||||||||||||||||||||||||||||||||||||||||||||||||||||||||||||||||||||||||||||||||||||||||||||||||
| Other | 34 | |||||||||||||||||||||||||||||||||||||||||||||||||||||||||||||||||||||||||||||||||||||||||||||||||||||||||||||
2002 - 2018 National Fire Incident Reporting System (NFIRS) incidents
- Incident types reported to NFIRS in Mineola, NY
- 1,43638.6%False Alarm
- 1,26033.9%Hazardous Condition
- 41411.1%Fire
- 2496.7%Good Intent Call
- 1895.1%Service Call
- 1544.1%Rescue & EMS
- 110.3%Overpressure Rupture
- 90.2%Special Incident
- Fire incident types reported to NFIRS in Mineola, NY
- 14635.3%Structure Fires
- 11928.7%Outside Fires
- 10625.6%Other
- 4310.4%Mobile Property/Vehicle Fires
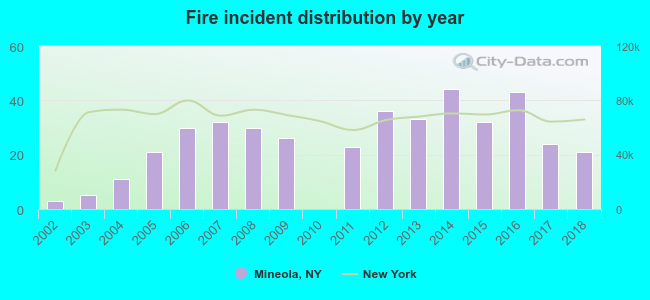 According to the data from the years 2002 - 2018 the average number of fire incidents per year is 24. The highest number of reported fire incidents - 44 took place in 2014, and the least - 0 in 2010. The data has a rising trend.
The average number of yearly fire incidents per 10k residents in Mineola, NY compared to nearest cities:
(Note: Based on data for the last 3 years, including only cities with population 5,000 and above)
| Mineola: | 15.4 |
| Williston Park: | 14.1 |
| Garden City Park: | 7.3 |
| Garden City: | 21.7 |
| Albertson: | 3.9 |
| Roslyn Heights: | 6.6 |
| North New Hyde Park: | 6.4 |
| New Hyde Park: | 20.8 |
| North Hills: | 1.9 |
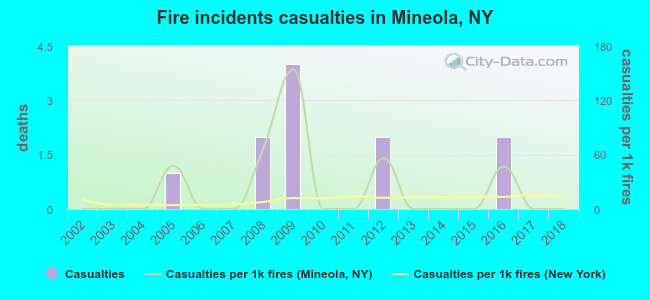 Based on the reports from the years 2002 - 2018 the average number of fire-related casualties per year is 1. The highest number of reported injuries - 4 took place in 2009, and the lowest - 0 in 2002. The data has a constant trend.
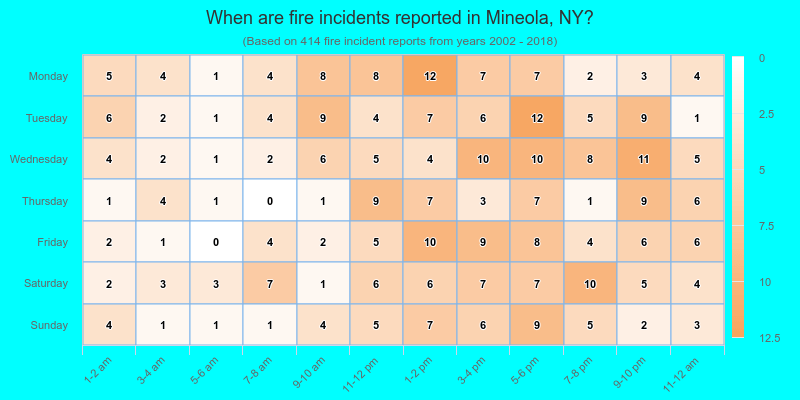
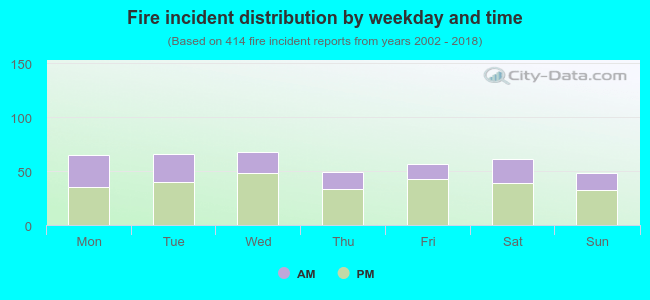 34.8% incidents where reported in the morning and 65.2% in the evening. The most fires (16.4%) took place on Wednesday, and the least (11.6%) on Sunday.
 According to the 414 fire incident reports from years 2002 - 2018 most fires (11.6%) took place during April, and the least (4.8%) in December.
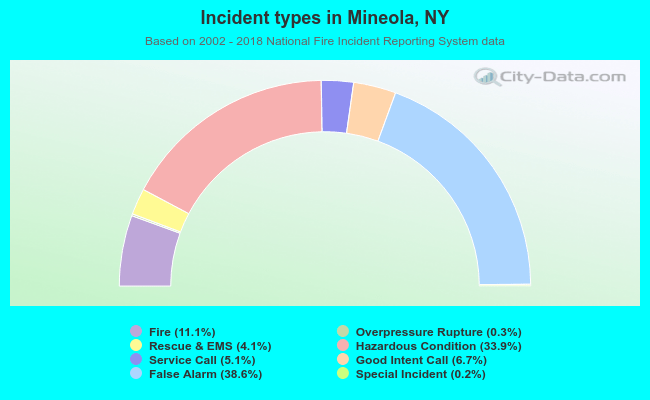 Out of all 3,722 cases reported during the years 2002 - 2018, the most belonged to the categories: False Alarm (38.6%), Hazardous Condition (33.9%), and Fire (11.1%).
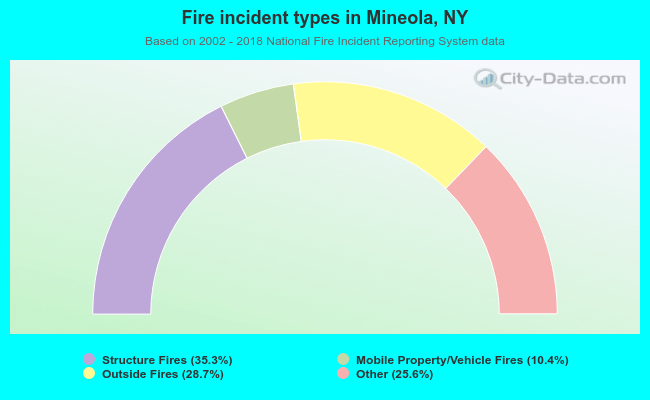 When looking into fire subcategories, the most incidents belonged to: Structure Fires (35.3%), and Outside Fires (28.7%).