| Fire incidents reported |
|---|
| Sreet name | Count |
|---|
| COASTAL HWY | 40 | | PALMER ST | 32 | | BROADKILL RD | 30 | | UNION ST | 20 | | CHESTNUT ST | 14 | | HARBESON RD | 14 | | BAYSHORE DR | 12 | | DIAMOND FARM RD | 12 | | HUDSON RD | 12 | | PETTYJOHN RD | 12 | | REYNOLDS POND RD | 12 | | CAVE NECK RD | 10 | | CEDAR CREEK RD | 10 | | FEDERAL ST | 10 | | GRAVEL HILL RD | 10 | | SHINGLE POINT RD | 10 | | UNION STRE | 10 | | ATLANTIC ST | 8 | | CARPENTER RD | 8 | | FOREST RD | 8 | | FRONT ST | 8 | | ISAACS RD | 8 | | MARTINS FARM RD | 8 | | SPINNAKER LN | 8 | | 116 FRONT ST | 6 |
| | | Fire incidents reported |
|---|
| Sreet name | Count |
|---|
| COOL SPRING RD | 6 | | MILTONELLENDALE HWY | 6 | | MOUNTAIN LAUREL DR | 6 | | MULBERRY ST | 6 | | OCKELS LN | 6 | | ROUND POLE BRIDGE RD | 6 | | SAM LUCAS RD | 6 | | 1 RT | 4 | | 88 RT | 4 | | BLACK DR | 4 | | BROAD ST | 4 | | BURTON RD | 4 | | CEDAR CREEK RD | 4 | | CLYDES DR | 4 | | COLLINS ST | 4 | | CONWELL ST | 4 | | CREEK DR | 4 | | DONOVAN RD | 4 | | EAGLE CREST ROAD | 4 | | FOREST RD. | 4 | | FORREST RD | 4 | | HARBESON RD | 4 | | LAVINIA ST | 4 | | LEWES-GEORGETOWN HWY | 4 | | |
|
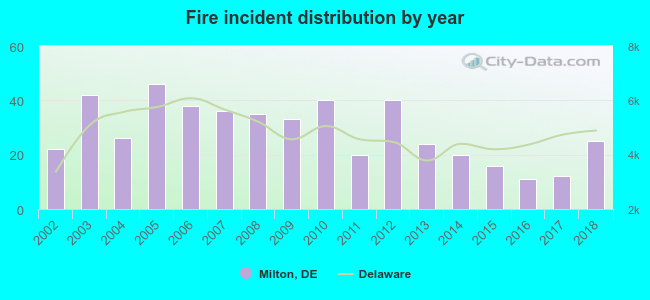 According to the data from the years 2002 - 2018 the average number of fires per year is 29. The highest number of fires - 46 took place in 2005, and the least - 11 in 2016. The data has a growing trend.
 35.2% incidents where reported in the morning and 64.8% in the evening. The most fires (18.9%) took place on Friday, and the least (11.3%) on Sunday.
 According to the 486 reports from years 2002 - 2018 most fires (13.2%) took place during March, and the least (4.3%) in September.
 Out of all 1,674 cases reported during the years 2002 - 2018, the most belonged to the categories: Fire (29.0%), Rescue & EMS (27.0%), and Hazardous Condition (17.6%).
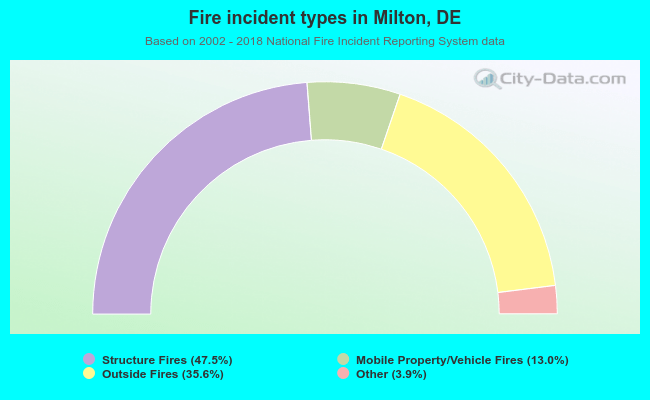 When looking into fire subcategories, the most reports belonged to: Structure Fires (47.5%), and Outside Fires (35.6%).