| Fire incidents reported |
|---|
| Sreet name | Count |
|---|
| NORTH AVE | 40 | | LINCOLN AVE | 38 | | EVERGREEN AVE | 30 | | CLARA ST | 14 | | MCKNIGHT RAOD | 10 | | SAMPLE ST | 10 | | STANTON AVE | 10 | | MAIN STREET SHARSBURG | 8 | | MT TROY ROAD | 8 | | SIEGEL ST | 8 | | DEWEY STREET ETNA | 6 | | EVERGREEN RD | 6 | | HAWTHORNE RD | 6 | | RESERVE ST | 6 | | ROUTE 28 | 6 | | FRIDAY ROAD | 4 | | GRANT AVE | 4 | | GUYASUTA ROAD ASPINWALL | 4 | | LINCOLN AVE | 4 | | MCINTYRE ROSS | 4 | | OBRIEN ST | 4 | | ROUTE 28 HWY | 4 | | SEAVY RD | 4 | | SEDGWICK ST | 4 | | SPRING GARDEN RESERVE | 4 |
| | | Fire incidents reported |
|---|
| Sreet name | Count |
|---|
| 220 NORTH AVE | 2 | | 264 STATION | 2 | | 416 SAMPLE ST | 2 | | ADELE ROSS | 2 | | ALMA STREET ETNA | 2 | | AMITY ROSS | 2 | | BUTLER | 2 | | BUTLER ST | 2 | | BUTLER STREET ETNA | 2 | | CECIL STREET SHARPSBURH | 2 | | CENTER AVE BLAWNOX | 2 | | CHAPMAN SHARPSBURG | 2 | | CHATMAN STREET SHARPSBURG | 2 | | CHERYL DRIVE ROSS | 2 | | CHRISNAR APTS | 2 | | CLAY SHARPSBURG | 2 | | CLIFTON AVE SHARPSBURG | 2 | | COLTON ST | 2 | | COMMERCIAL ASPINWALL | 2 | | CONVENT DR | 2 | | EAST OHIO ST | 2 | | EIGHTEEN STREET SHARPSBUG | 2 | | ELEVEN STREET SHARPSBURG | 2 | | ELIZABETH ST | 2 | | FIFTH STREET ASPINWALL | 2 |
|
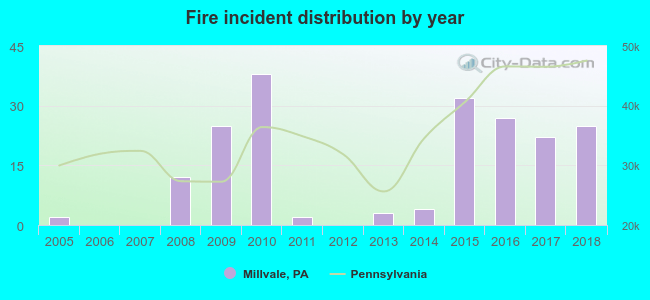 According to the data from the years 2005 - 2018 the average number of fire incidents per year is 14. The highest number of fires - 38 took place in 2010, and the least - 0 in 2006. The data has a growing trend.
 25.0% incidents where reported in the morning and 75.0% in the evening. The most fires (19.8%) took place on Wednesday, and the least (9.4%) on Tuesday.
 According to the 192 incident reports from years 2005 - 2018 most fires (15.6%) took place during February, and the least (1.6%) in October.
 Out of all 1,324 cases reported during the years 2005 - 2018, the most belonged to the categories: Service Call (25.8%), Overpressure Rupture (18.3%), and Fire (14.5%).
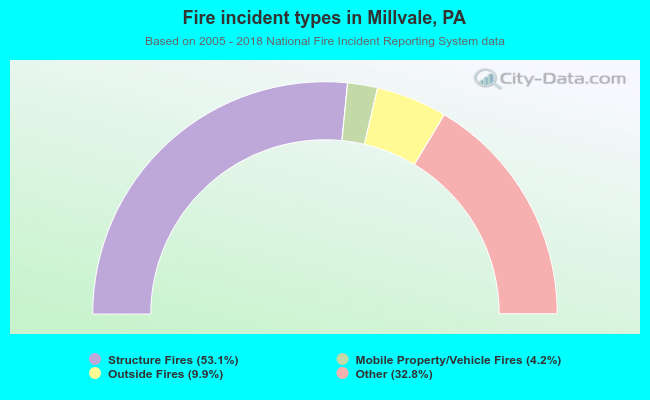 When looking into fire subcategories, the most reports belonged to: Structure Fires (53.1%), and Other (32.8%).