Mills: Fire Incidents, Wyoming (WY)
Where are fire incidents reported in Mills, WY
Something went wrong! Please refresh the page.
|
| |||||||||||||||||||||||||||||||||||||||||||||||||||||||||||||||||||||||||||||||||||||||||||||||||||||||||||||
2002 - 2018 National Fire Incident Reporting System (NFIRS) incidents
- Incident types reported to NFIRS in Mills, WY
- 1,01340.1%Rescue & EMS
- 71928.4%Good Intent Call
- 39515.6%Fire
- 2469.7%Hazardous Condition
- 1174.6%Service Call
- 341.3%False Alarm
- Fire incident types reported to NFIRS in Mills, WY
- 15138.2%Structure Fires
- 12531.6%Outside Fires
- 6015.2%Mobile Property/Vehicle Fires
- 5914.9%Other
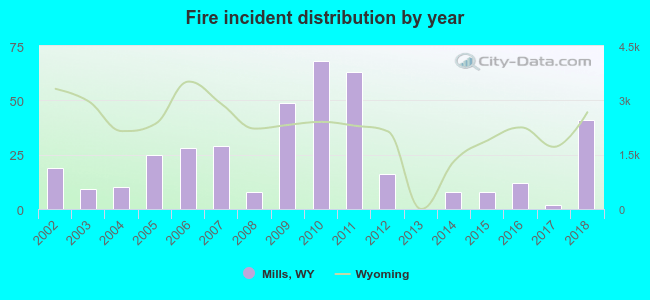 According to the data from the years 2002 - 2018 the average number of fire incidents per year is 23. The highest number of reported fires - 68 took place in 2010, and the least - 0 in 2013. The data has a growing trend.
 32.9% incidents where reported in the morning and 67.1% in the evening. The most fires (18.2%) took place on Monday, and the least (10.9%) on Tuesday.
 According to the 395 fire incidents from years 2002 - 2018 most fires (14.9%) took place during July, and the least (5.3%) in December.
 Out of all 2,528 cases reported during the years 2002 - 2018, the most belonged to the categories: Rescue & EMS (40.1%), Good Intent Call (28.4%), and Fire (15.6%).
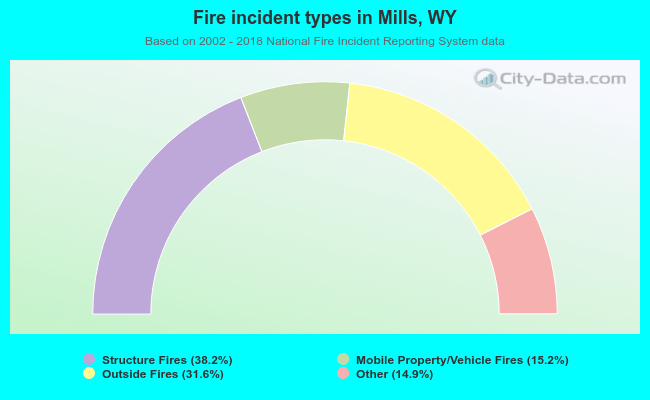 When looking into fire subcategories, the most incidents belonged to: Structure Fires (38.2%), and Outside Fires (31.6%).