| Fire incidents reported |
|---|
| Sreet name | Count |
|---|
| CYPRESS ST. | 16 | | RIVER RD | 16 | | CYPRESS ST | 10 | | HARDWOOD MILLS LANE | 10 | | MILLINGTON ROAD | 10 | | RIVER ROAD | 10 | | SASSAFRAS STREET | 10 | | BIG STONE RD | 8 | | CHESTER RIVER HEIGHTS RD | 8 | | CHESTERVILLE BRIDGE RD | 8 | | CYPRESS RD | 8 | | CYPRESS ROAD | 8 | | CYPRESS ST | 8 | | CYPRESS STREET | 8 | | DUDLEY CORNER RD | 8 | | SASSAFRAS ST | 8 | | SASSAFRASS ST. | 8 | | BIG STONE RD | 6 | | CHESTERVILLE BRIDGE ROAD | 6 | | CRANE STREET | 6 | | GALENA RD | 6 | | GALENA ROAD | 6 | | GLANDING ROAD | 6 | | GOLTS RD | 6 | | HARD WOOD MILLS RD | 6 |
| | | Fire incidents reported |
|---|
| Sreet name | Count |
|---|
| LIME LANDING RD. | 6 | | MORGNEC RD | 6 | | ROUTE 301 | 6 | | WALNUT TREE RD | 6 | | 10870 BIG STONE RD | 4 | | 109 PEARCE RD | 4 | | 115 SASSAFRASS ST | 4 | | 1800 DUDLEY CORNER RD | 4 | | 301 | 4 | | 328 WEST ST | 4 | | 350 CYPRESS ST | 4 | | 397 CYPRESS ST | 4 | | 420 LEGION RD | 4 | | BIG STONE ROAD | 4 | | BLACK BOTTOM RD | 4 | | BLUE STAR MEMORIAL HWY | 4 | | CARROLL CLARK RD | 4 | | CHESTERVILLE BRIDGE RD. | 4 | | CHESTERVILLE FOREST RD | 4 | | CHESTERVILLE FOREST ROAD | 4 | | CHESTERVILLE ROAD | 4 | | DAISY DRIVE | 4 | | DUDLEY CHANCE ROAD | 4 | | GROFF RD | 4 | | |
|
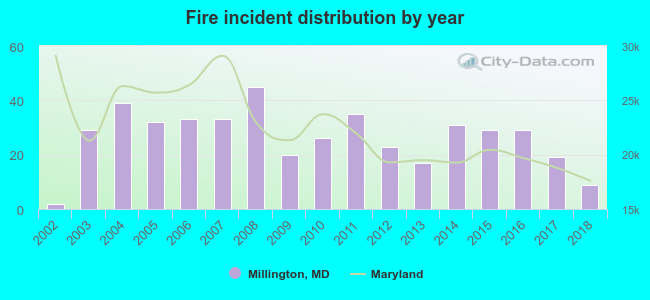 According to the data from the years 2002 - 2018 the average number of fires per year is 27. The highest number of reported fires - 45 took place in 2008, and the least - 2 in 2002. The data has a rising trend.
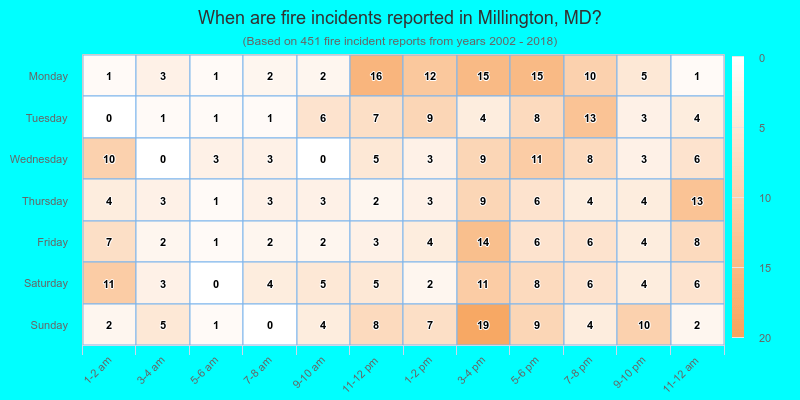
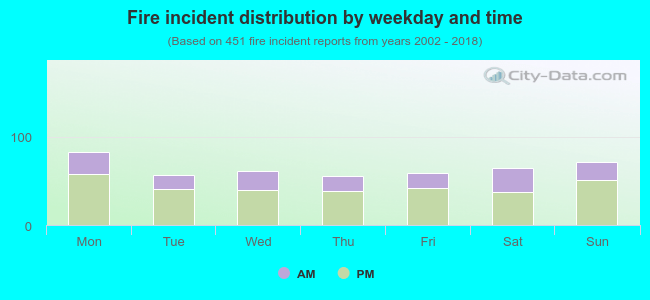 31.7% incidents where reported in the morning and 68.3% in the evening. The most fires (18.4%) took place on Monday, and the least (12.2%) on Thursday.
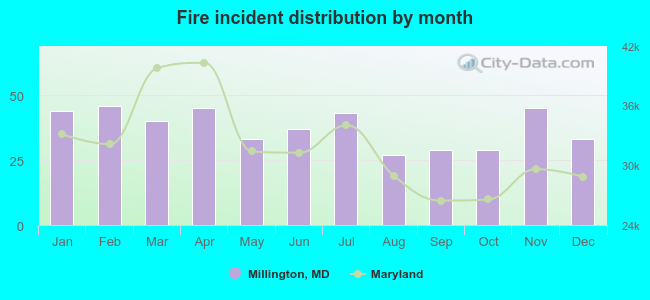 According to the 451 reports from years 2002 - 2018 most fires (10.2%) took place during February, and the least (6.0%) in August.
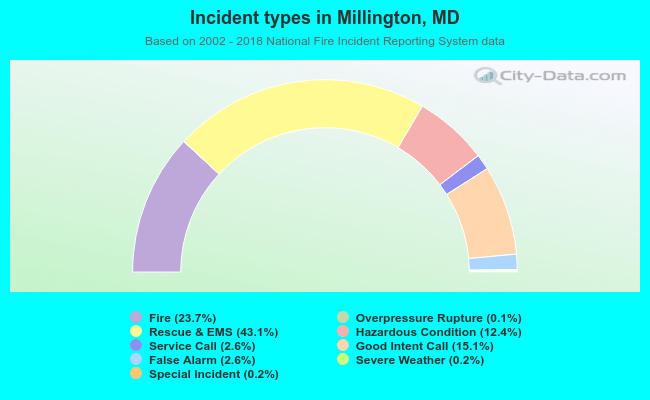 Out of all 1,899 cases reported during the years 2002 - 2018, the most belonged to the categories: Rescue & EMS (43.1%), Fire (23.7%), and Good Intent Call (15.1%).
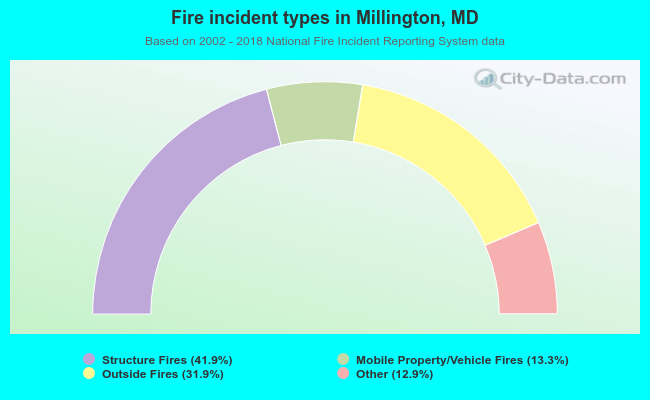 When looking into fire subcategories, the most reports belonged to: Structure Fires (41.9%), and Outside Fires (31.9%).