| Fire incidents reported |
|---|
| Sreet name | Count |
|---|
| BUCKWHEAT VALLEY RD | 18 | | ROUTE 322 | 14 | | DIMMSVILLE RD | 12 | | DEVER HOLLOW RD | 10 | | JUNIATA PARKWAY | 10 | | MARKET STREET ST | 10 | | 22322 RT | 8 | | BUCKWHEAT VALLEY RD | 8 | | MARKET ST | 8 | | MOUNTAIN RD | 8 | | RACCOON VALLEY RD | 8 | | SUGAR RUN ROAD | 8 | | THOMPSONTOWN BOROUGH | 8 | | BUCKWHEAT RD | 6 | | DIMMSVILLE RD | 6 | | JUNIATA PKY | 6 | | OLD ROUTE 22 | 6 | | OWL HOLLOW RD | 6 | | REWARD RD | 6 | | STATE ROUTE 17 RD | 6 | | STONE ARCH RD | 6 | | SUNBURY PATH | 6 | | CENTERVILLE RD | 4 | | CHERRY VALLEY RD | 4 | | DEVER HALLOW ROAD RD | 4 |
| | | Fire incidents reported |
|---|
| Sreet name | Count |
|---|
| DEVER HOLLOW RD | 4 | | FAYETTE TOWNSHP FIRE COMP | 4 | | FORD HILL RD | 4 | | HILL TOP RD | 4 | | JUNIATA PARKWAY RD | 4 | | LIVERPOOL | 4 | | MARKET STREET | 4 | | PFOUTZ VALLEY RD | 4 | | ROUTES 322 | 4 | | SUNBURY STREET | 4 | | TUSCURORA PATHWAY | 4 | | WINDING HILL RD | 4 | | ZELLERS LN | 4 | | 4118 BUCKWHEAT ROAD | 2 | | 4TH ST | 2 | | ACORN DR RD | 2 | | ACORN RD | 2 | | ACORN ROAD | 2 | | BARNES DR | 2 | | BOGEY DRIVE DR | 2 | | BREEZY HILL LN | 2 | | BUCKS VALLEY ROAD RD | 2 | | BUCKTAIL LANE LN | 2 | | BUCKWHEAT VALLEY ROAD RD | 2 | | BUFFALO TRACE RD | 2 |
|
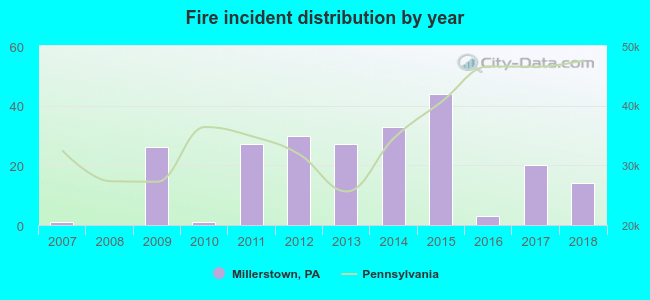 According to the data from the years 2007 - 2018 the average number of fire incidents per year is 19. The highest number of fires - 44 took place in 2015, and the least - 0 in 2008. The data has a growing trend.
 33.2% incidents where reported in the morning and 66.8% in the evening. The most fires (16.8%) took place on Monday, and the least (11.1%) on Wednesday.
 According to the 226 incident reports from years 2007 - 2018 most fires (15.0%) took place during April, and the least (1.8%) in July.
 Out of all 486 cases reported during the years 2007 - 2018, the most belonged to the categories: Fire (46.5%), Overpressure Rupture (21.8%), and Service Call (11.5%).
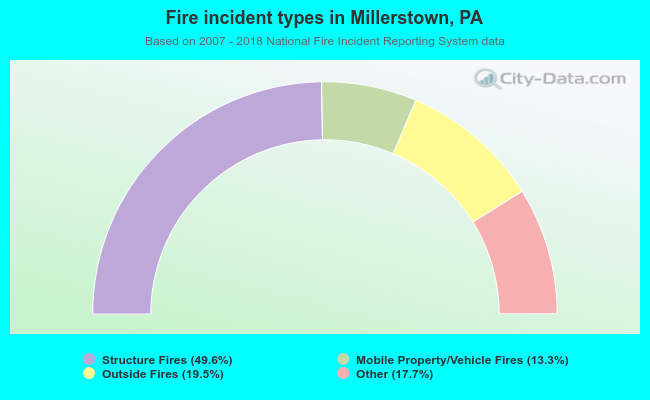 When looking into fire subcategories, the most reports belonged to: Structure Fires (49.6%), and Outside Fires (19.5%).